Overview
We have gone to great lengths to ensure that the A32NX flight model is as realistic as it gets. Collaborating with our own A320 pilot staff at FlyByWire Simulations and testing each change meticulously, the flight model is based on matching the data and other information obtained from the A320NEO Airplane Flight Manual, Flight Crew Operating Manual, Flight Crew Techniques Manual, Quick Reference Handbook, FlySmart electronic flight bag, and our A320NEO piloting team.
If you are a more data-oriented reader, below you can find comparisons between the reference data and our tests in MSFS. We have included a plethora of tables and charts for you.
Credits:
- donbikes for the flight model work,
- Taz for the engine modelling,
- Davy for the simulation of the autobrake system.
Note: Some of the smaller, more data-heavy images can be clicked on so you can view the data in full.
Work In Progress Tuning
Constant improvement with realistic and often very recent data points from our pilot staff is where we believe the A32NX shines. Recent updates to our aircraft fix issues with inadequate takeoff climb performance after an engine failure at heavy gross weights. You can now practice those V1 engine cuts at 2nd segment climb-limited TOGW. Be sure when doing so to not delay gear retraction, lower your pitch rate and pitch target, and apply appropriate rudder to minimize control and sideslip drag! (Note: This capability is currently only available in the Development and Experimental versions of the A32NX).
We are currently fine-tuning the landing gear drag to better match climb, cruise, and descent data for gear down operations. The results of our WIP tuning are included in the tables below. We expect to add these changes to the A32NX soon - we will start testing these in the Experimental version, then once they are sufficiently tested and stable we will publish it to the Development version, and eventually to our Stable releases.
We've also paid ample attention to the overall flying qualities -- such as including correct pitch changes ("ballooning") occurring with certain flap and spoiler deployment/retraction, accurate roll response, and we corrected the excessive pitch sensitivity that afflicts many MSFS airplanes.
We hope to continue bringing the best and most accurate flight model of the A320neo to Microsoft Flight Simulator.
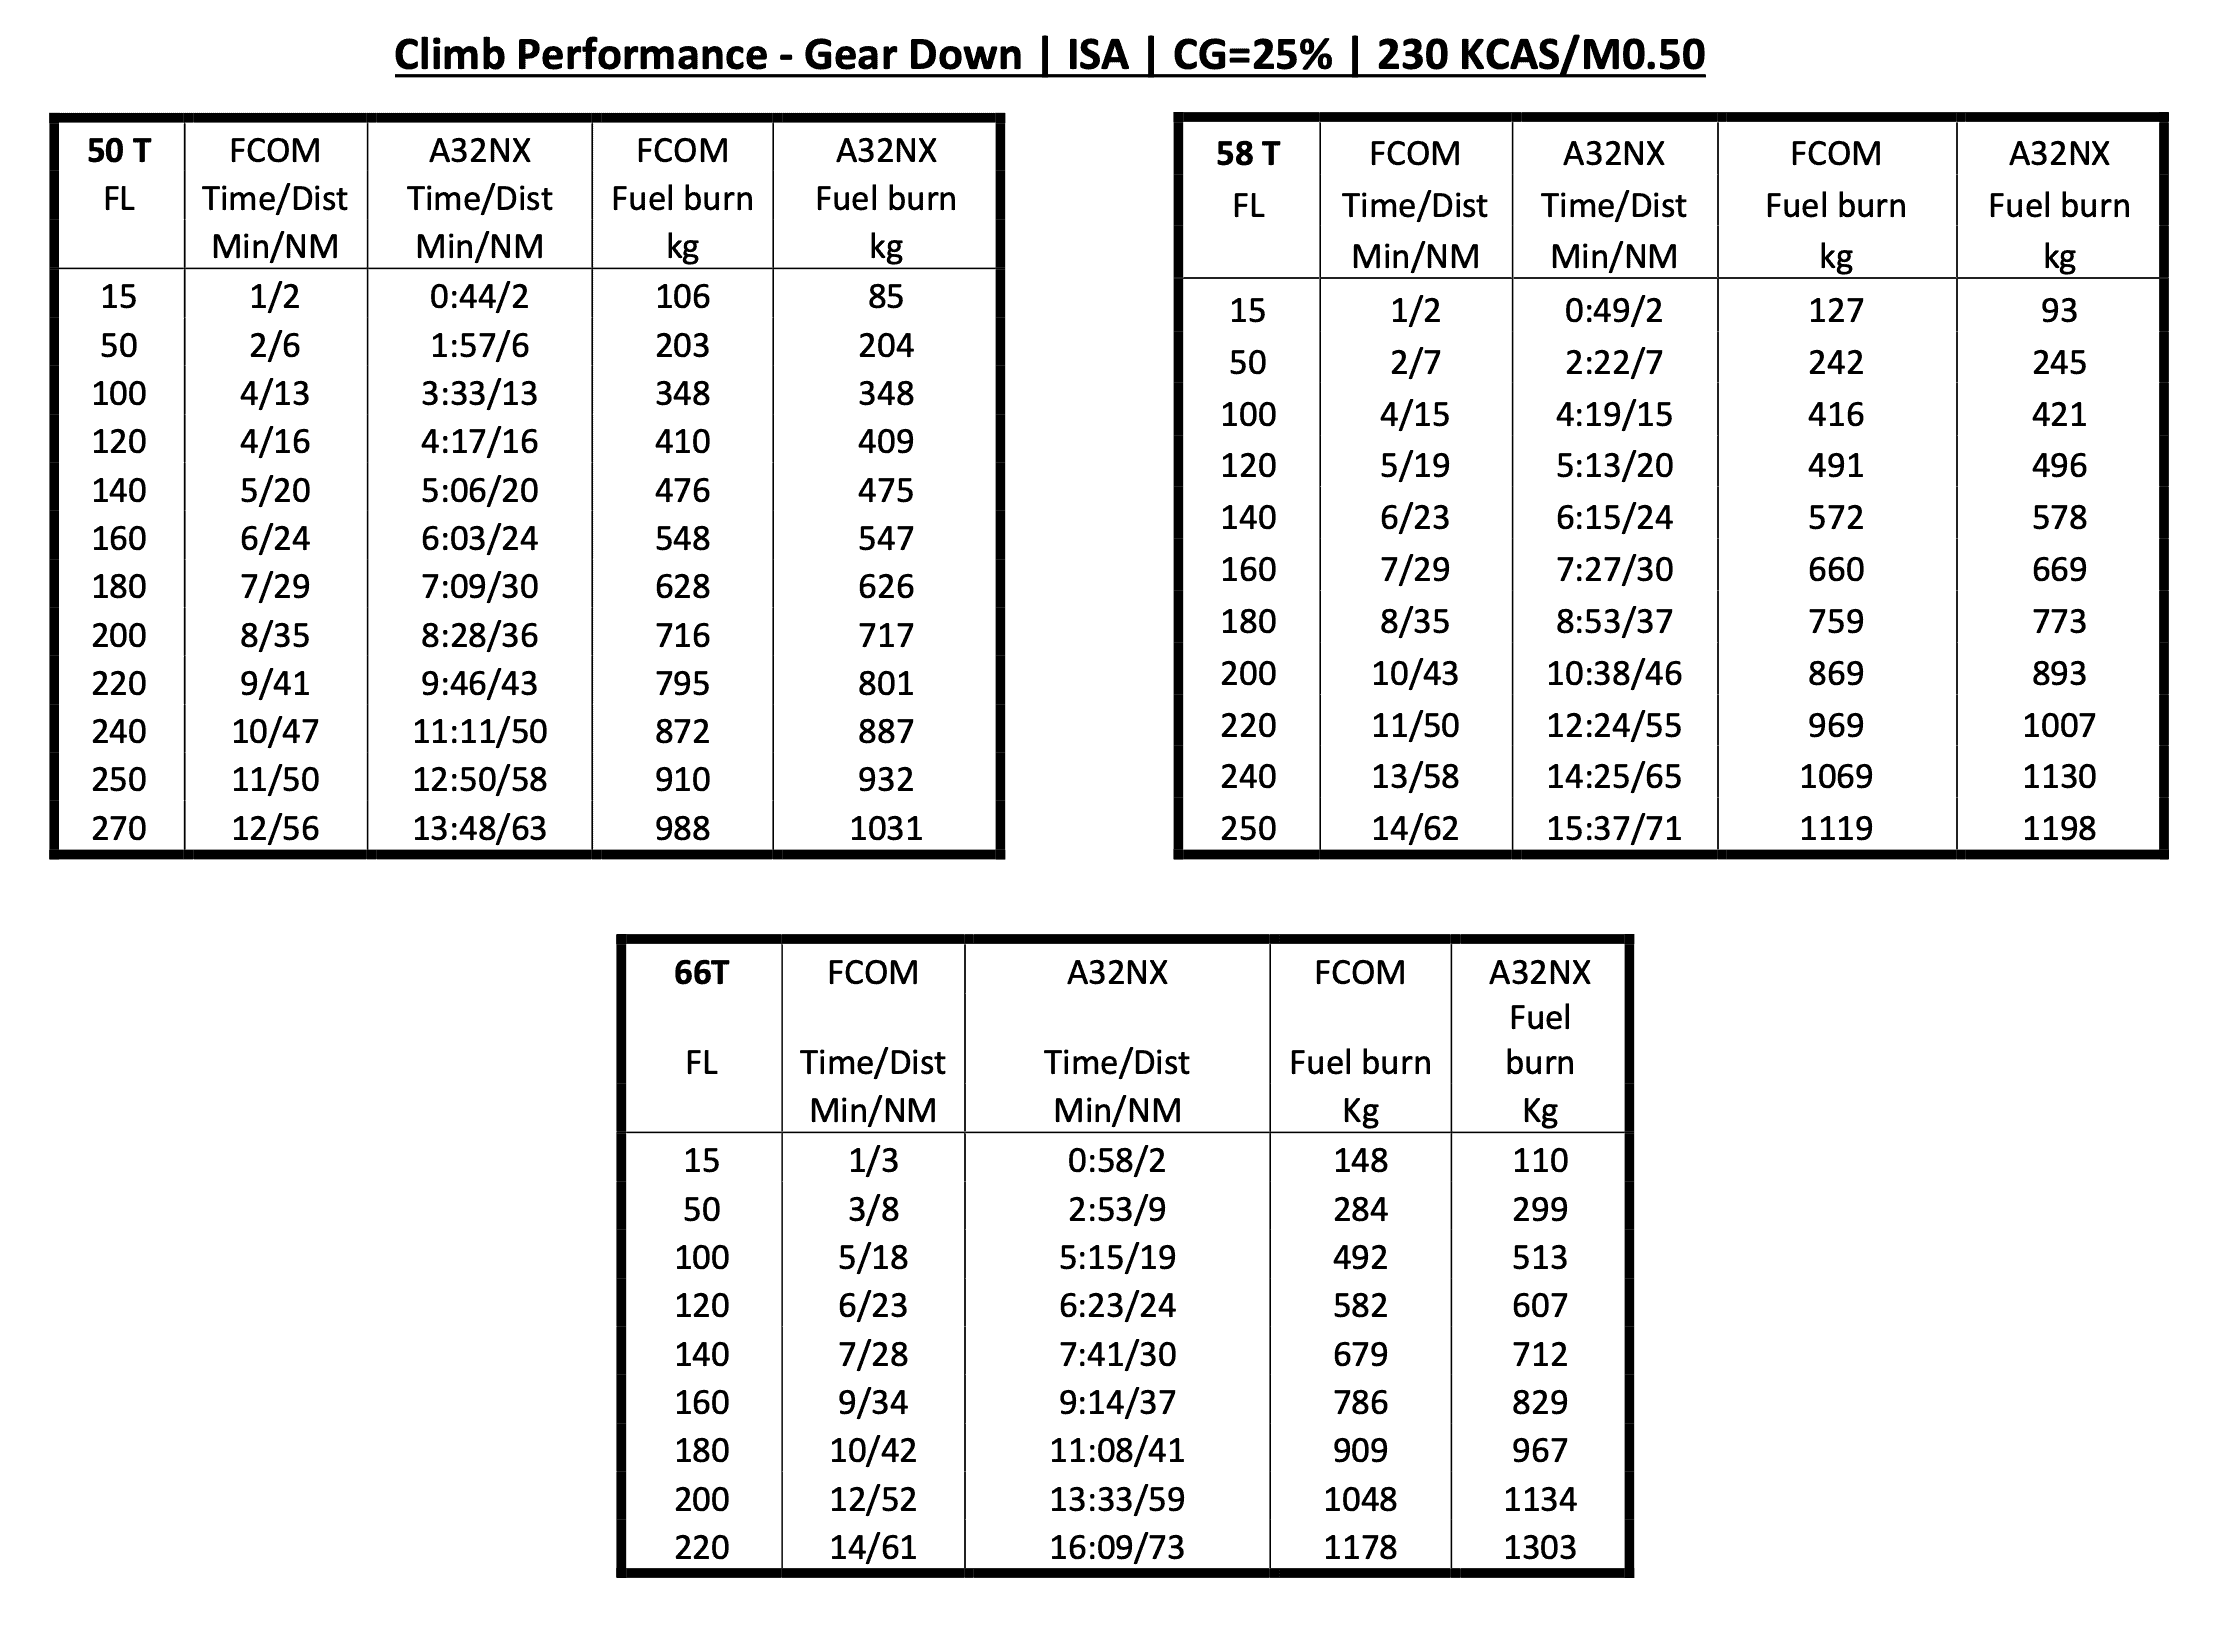
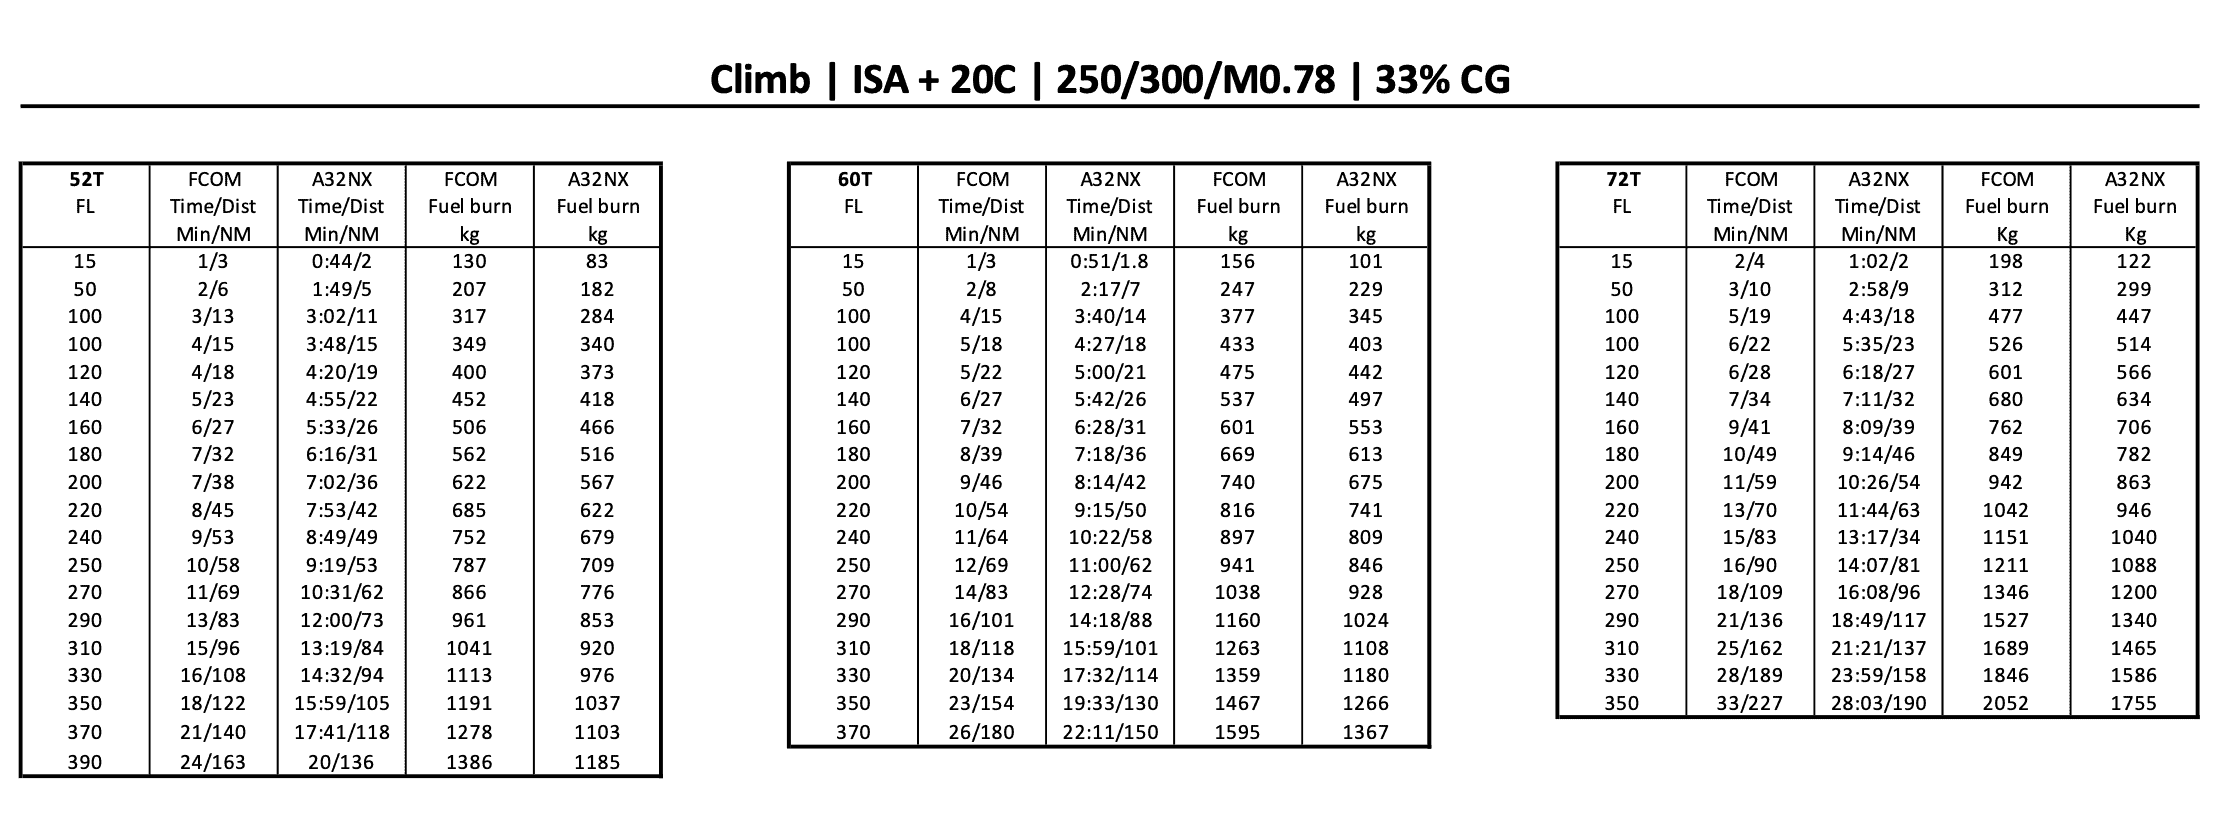
Climb Performance - Gear Down
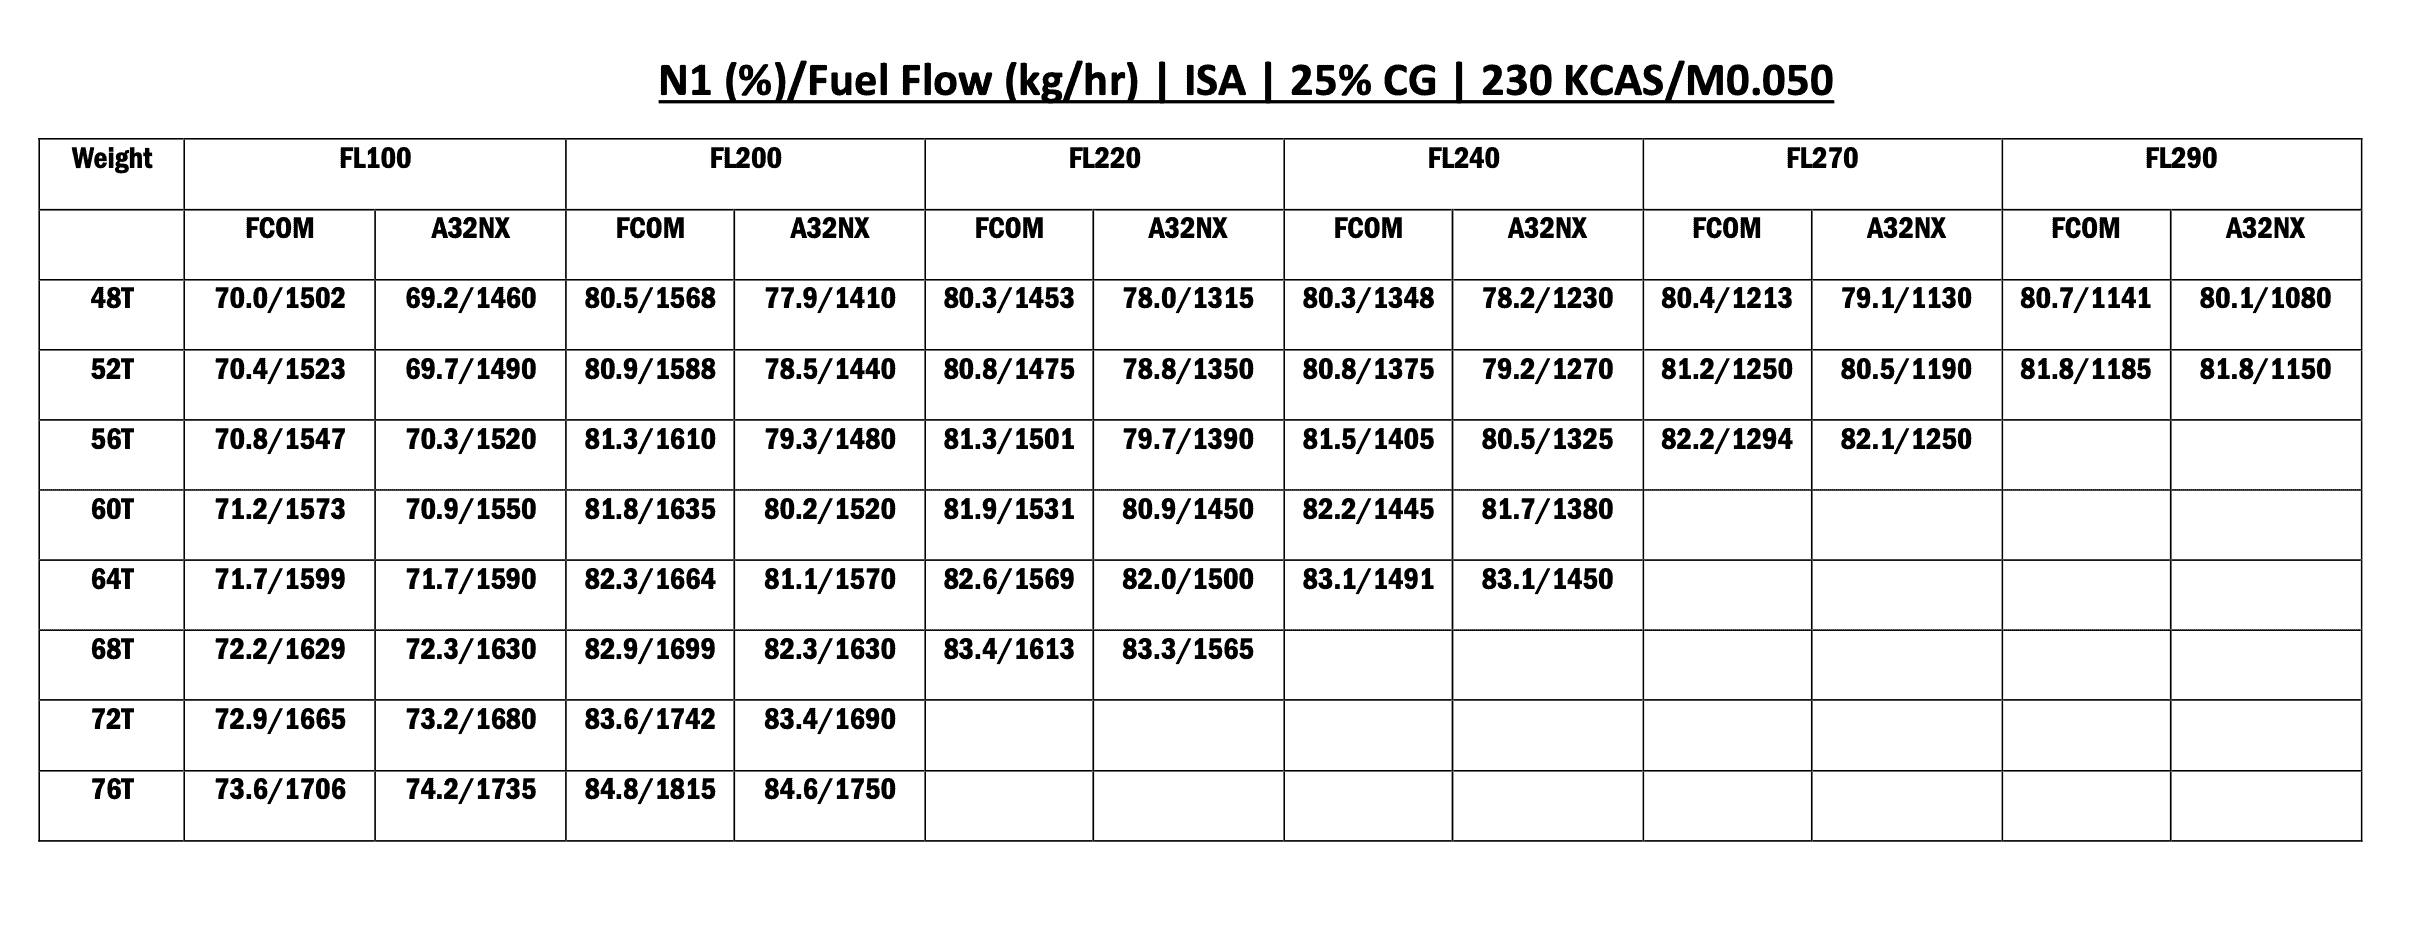
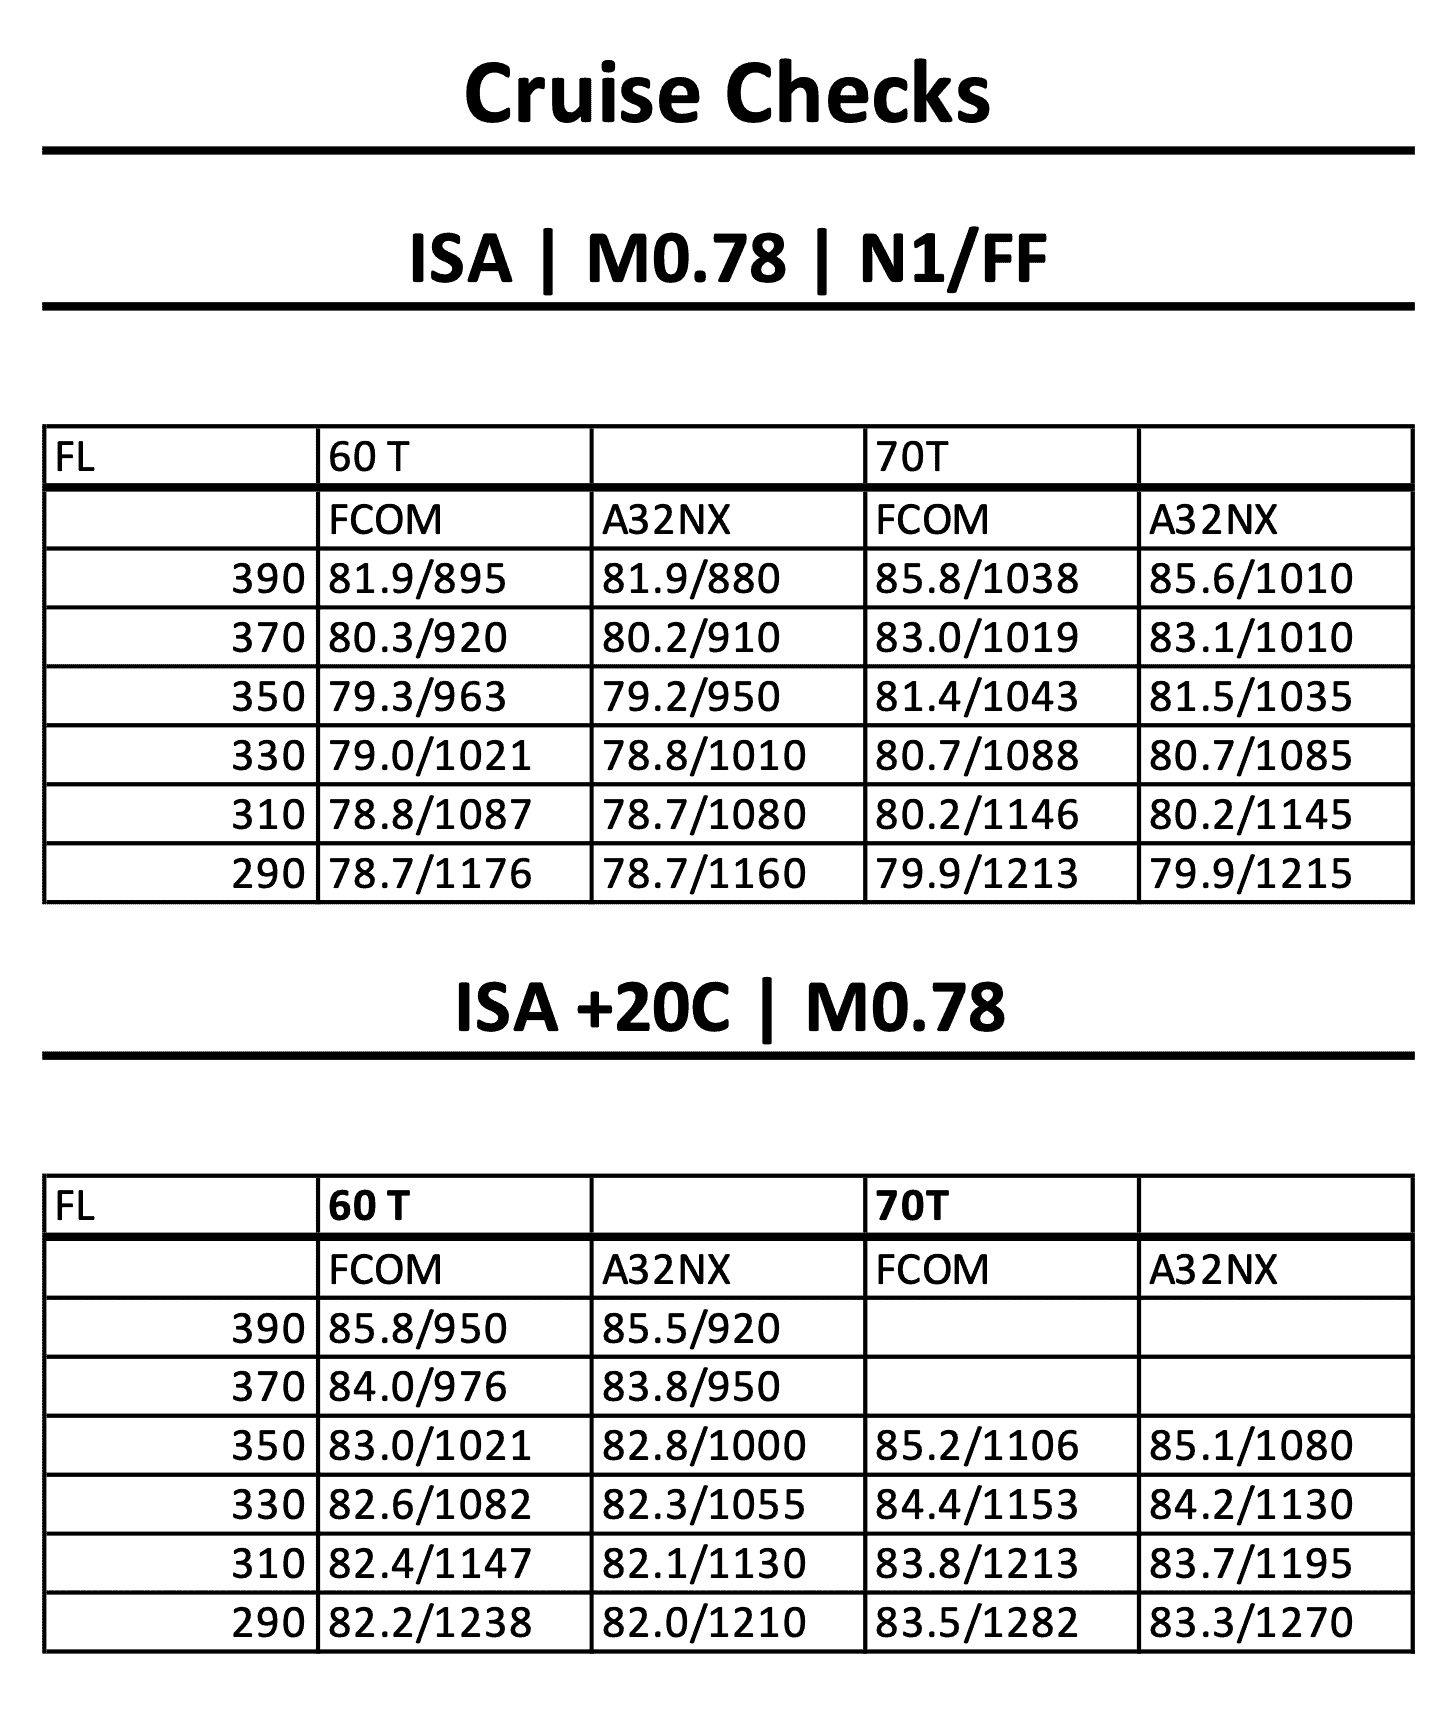
Cruise Checks - Gear Down
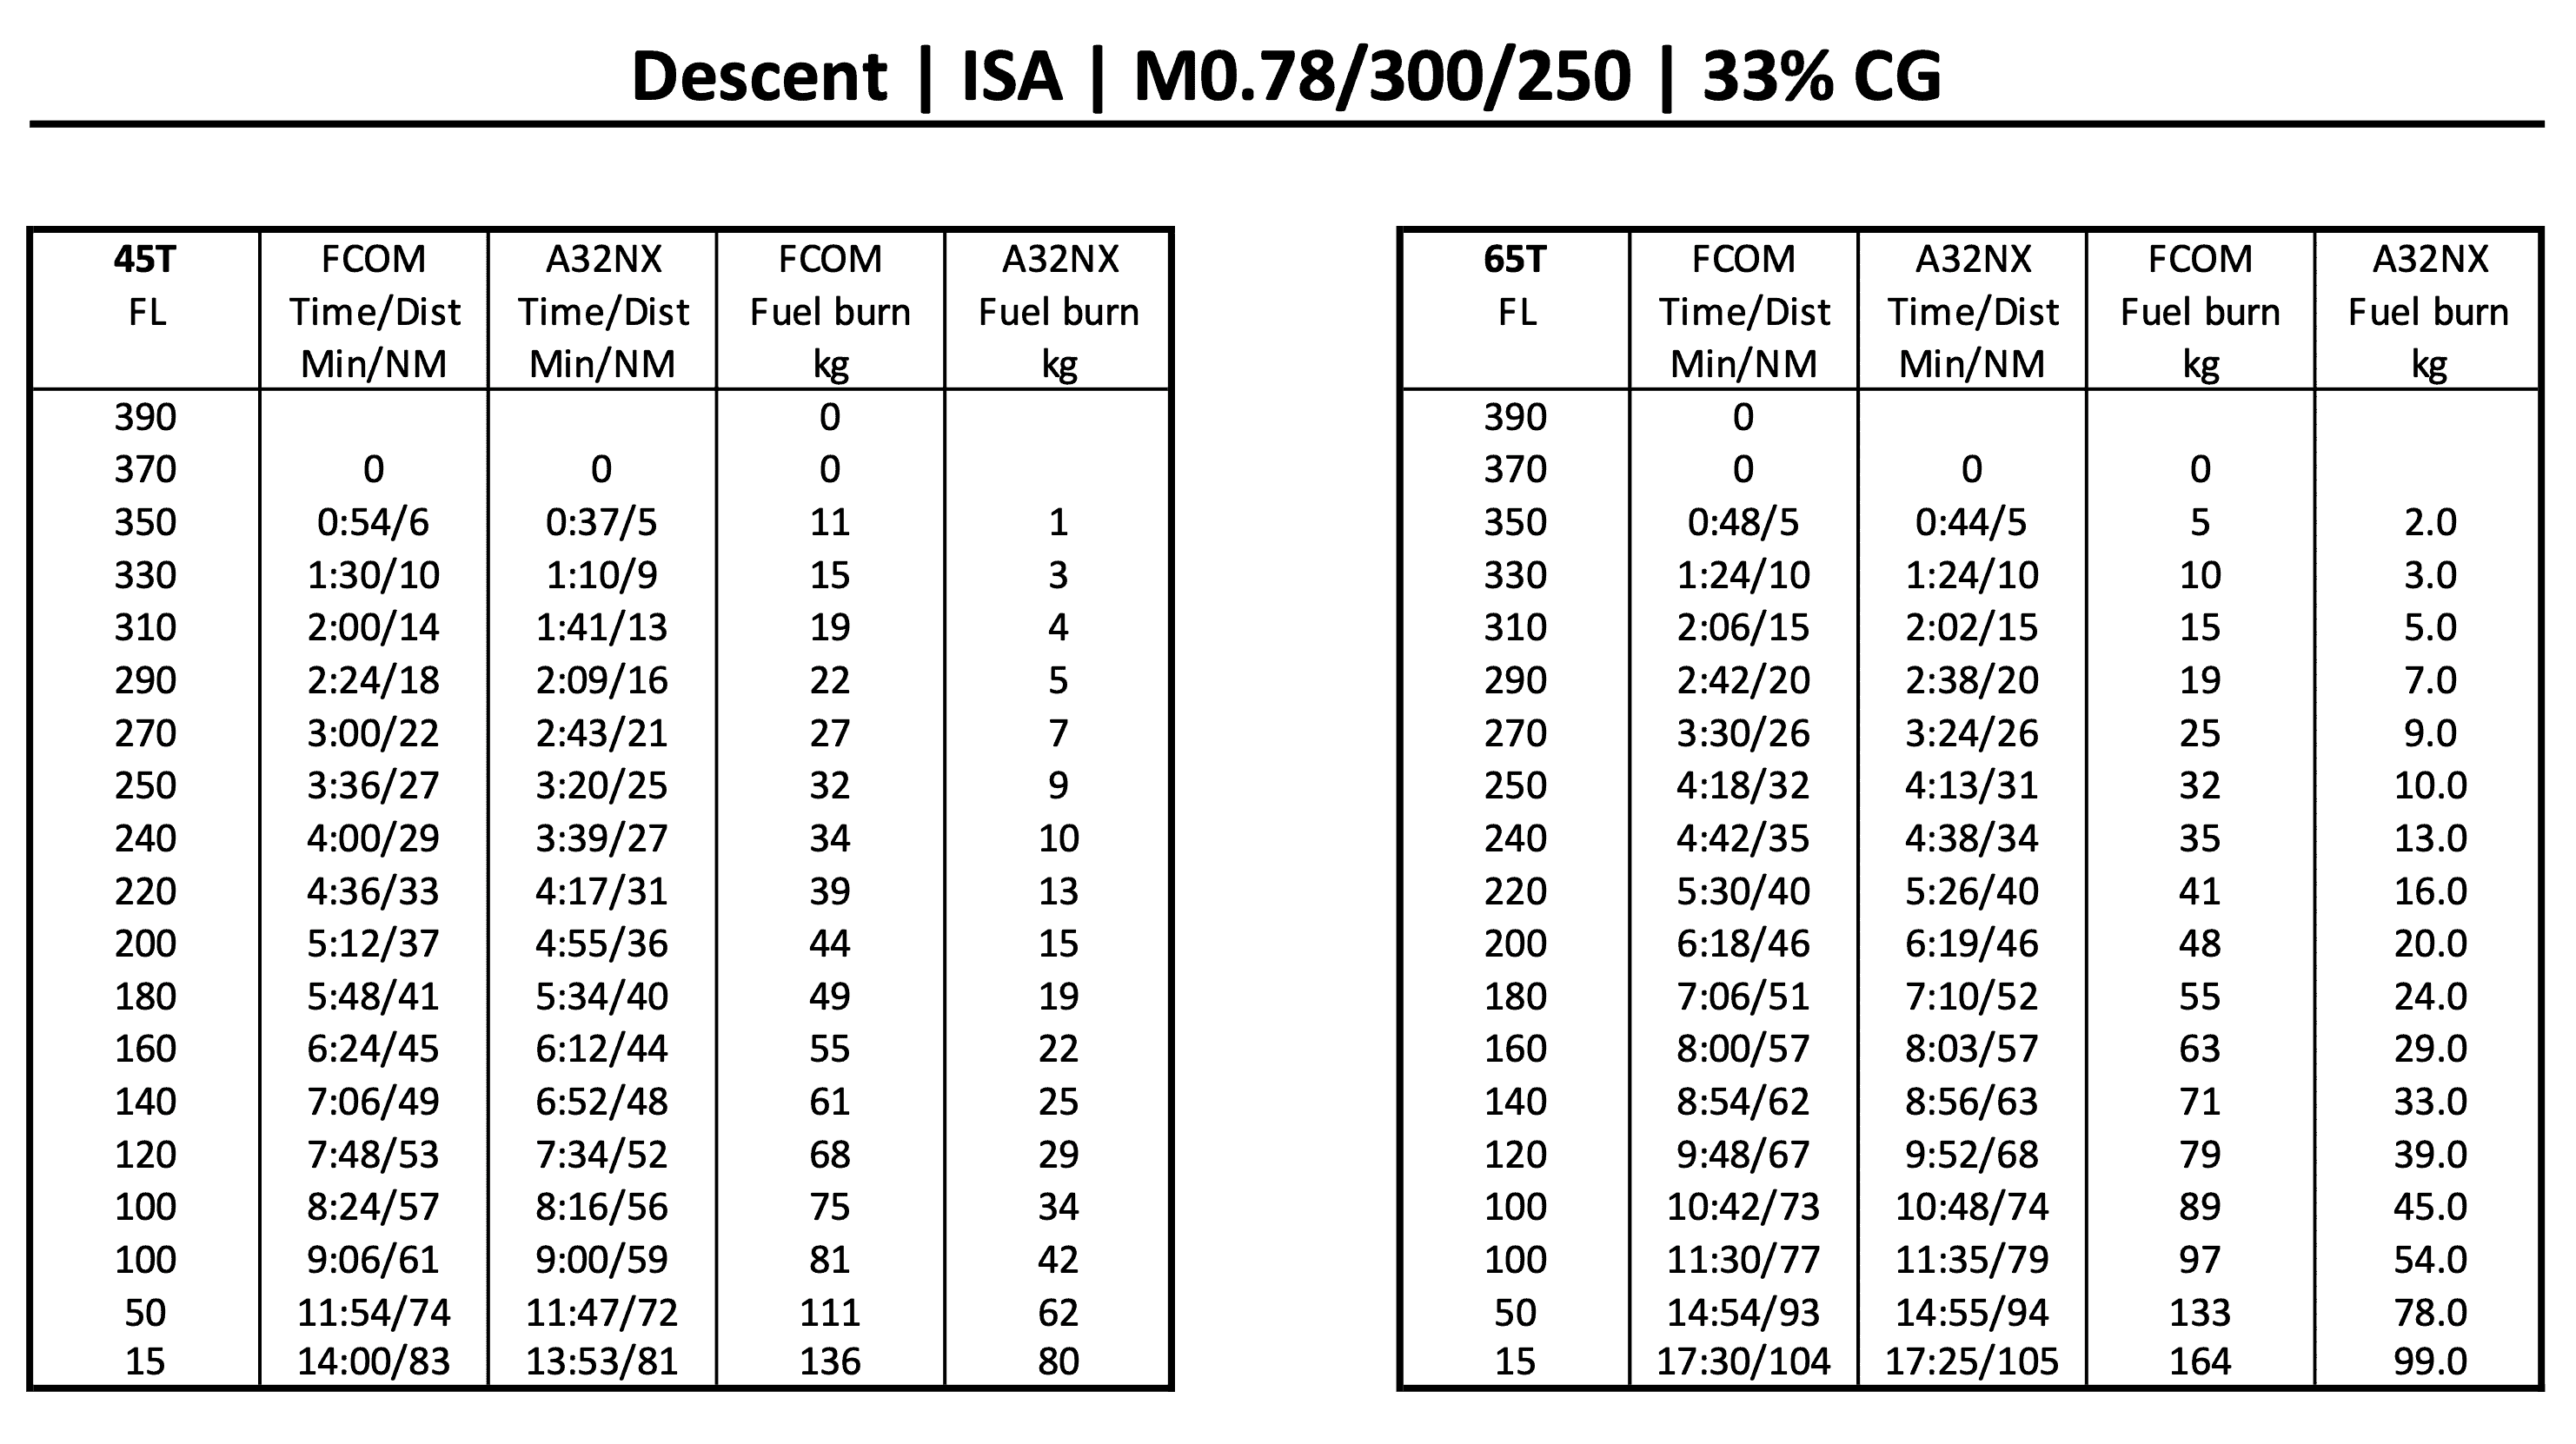
Descent Performance - Gear Down
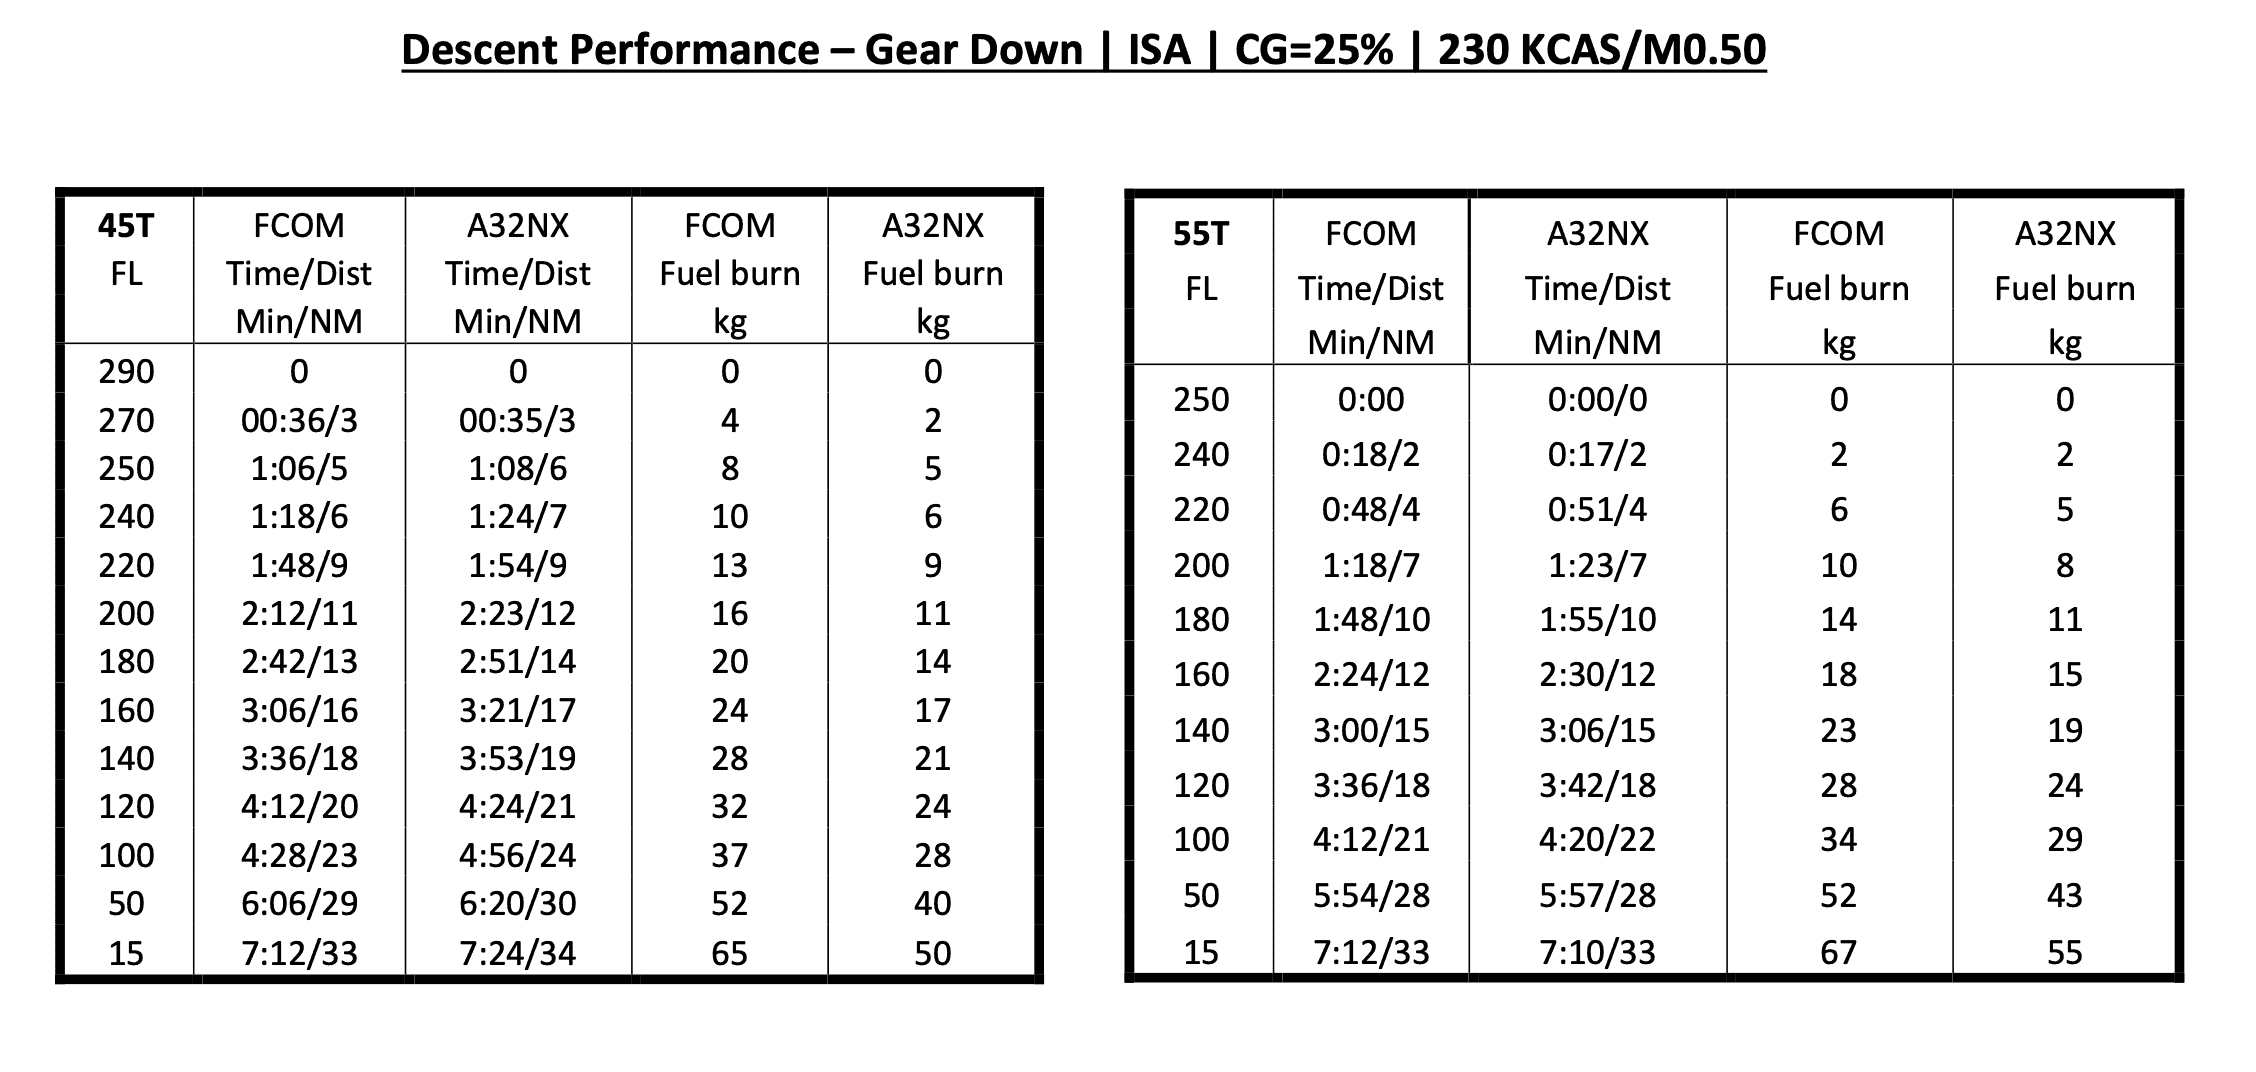
The small discrepancies in gear down performance (for example, climb performance at higher altitudes) are likely due to MSFS modelling of the gear down drag increment as a constant drag coefficient increment. In actuality, the gear drag coefficient increment varies inversely with lift coefficient.
Flight Model Data
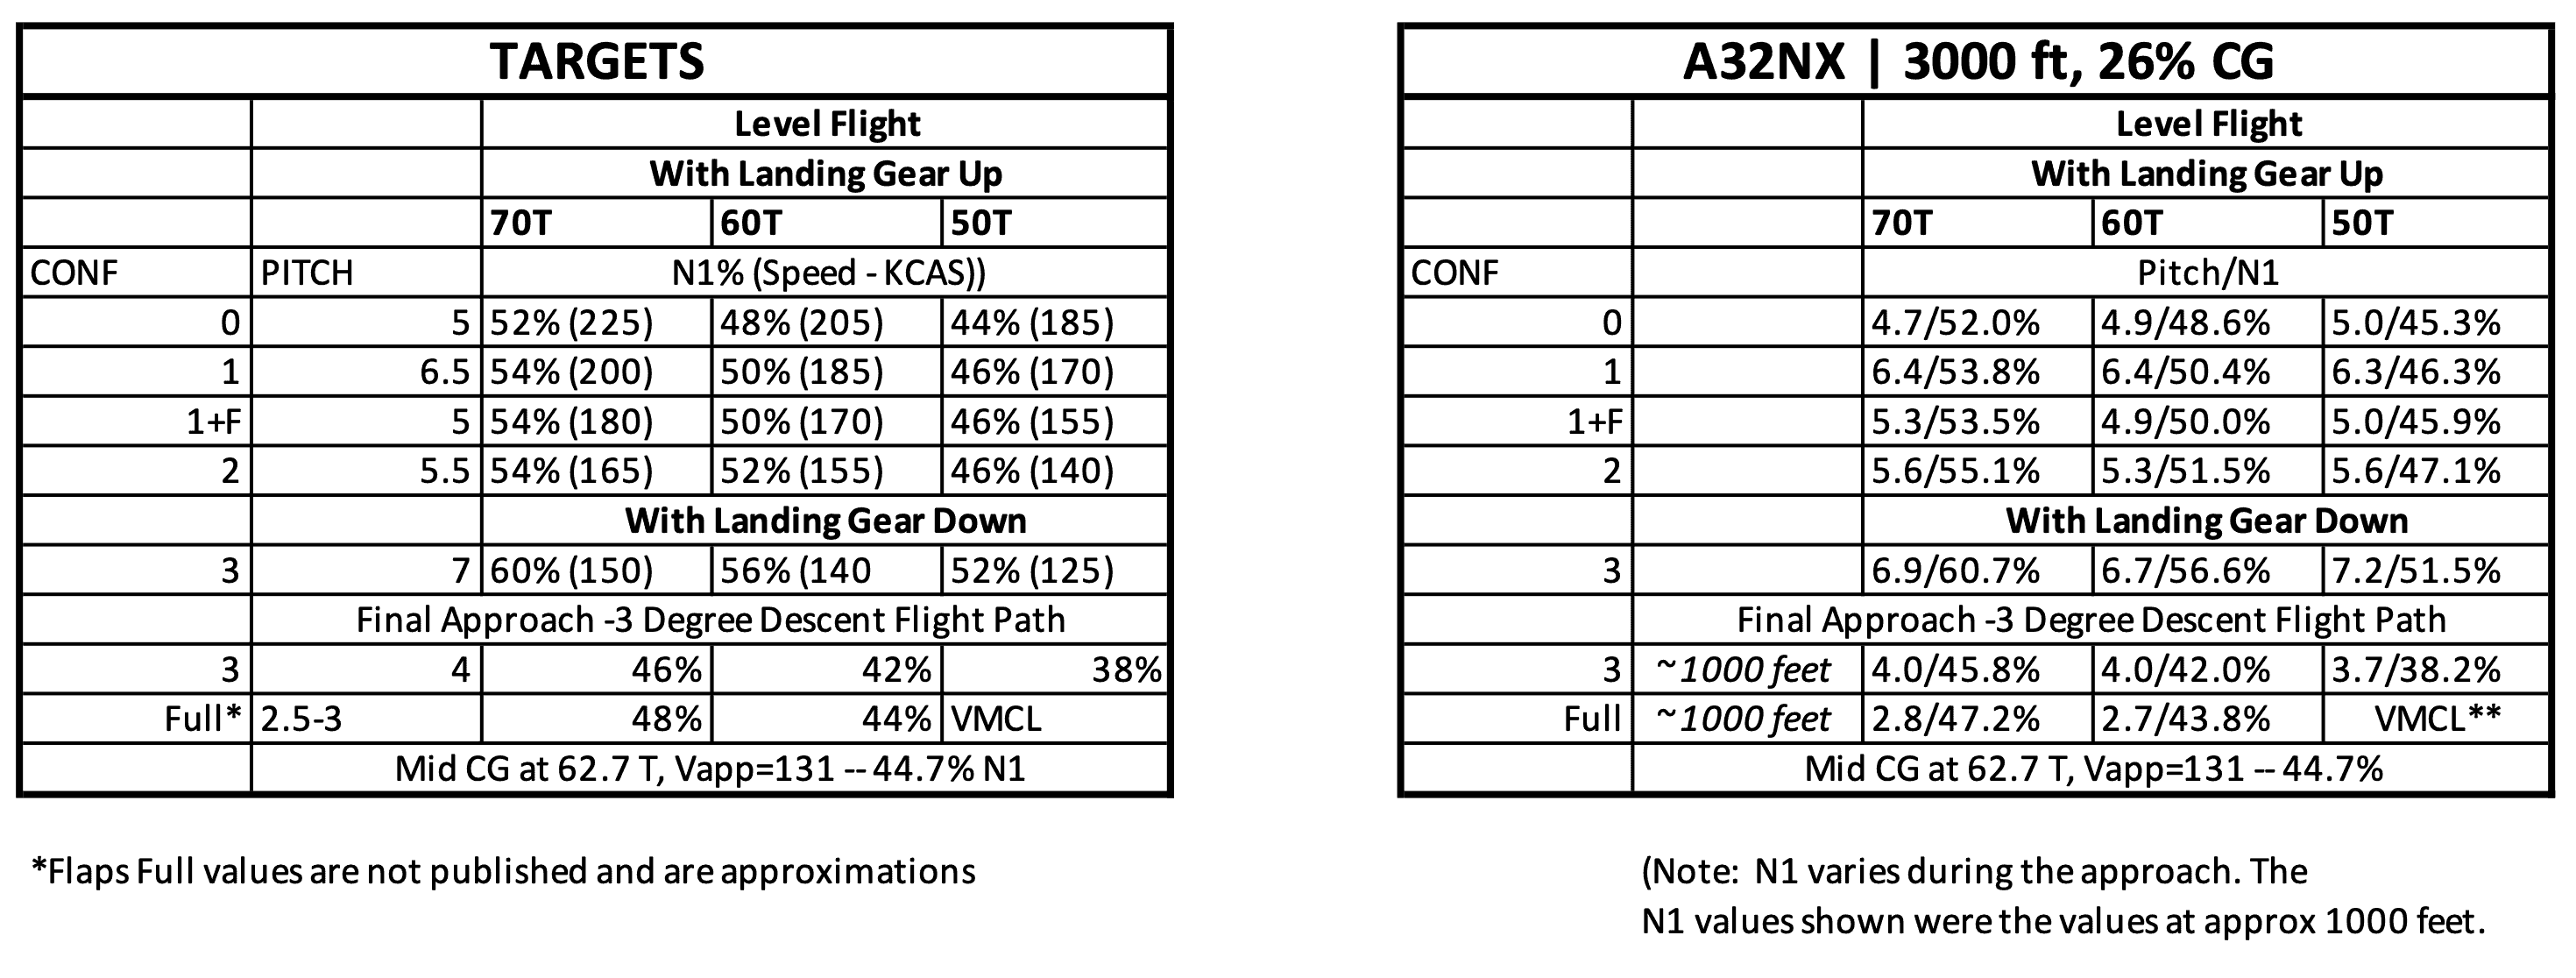
Pitch Angle Verification ("Targets are from QRH")
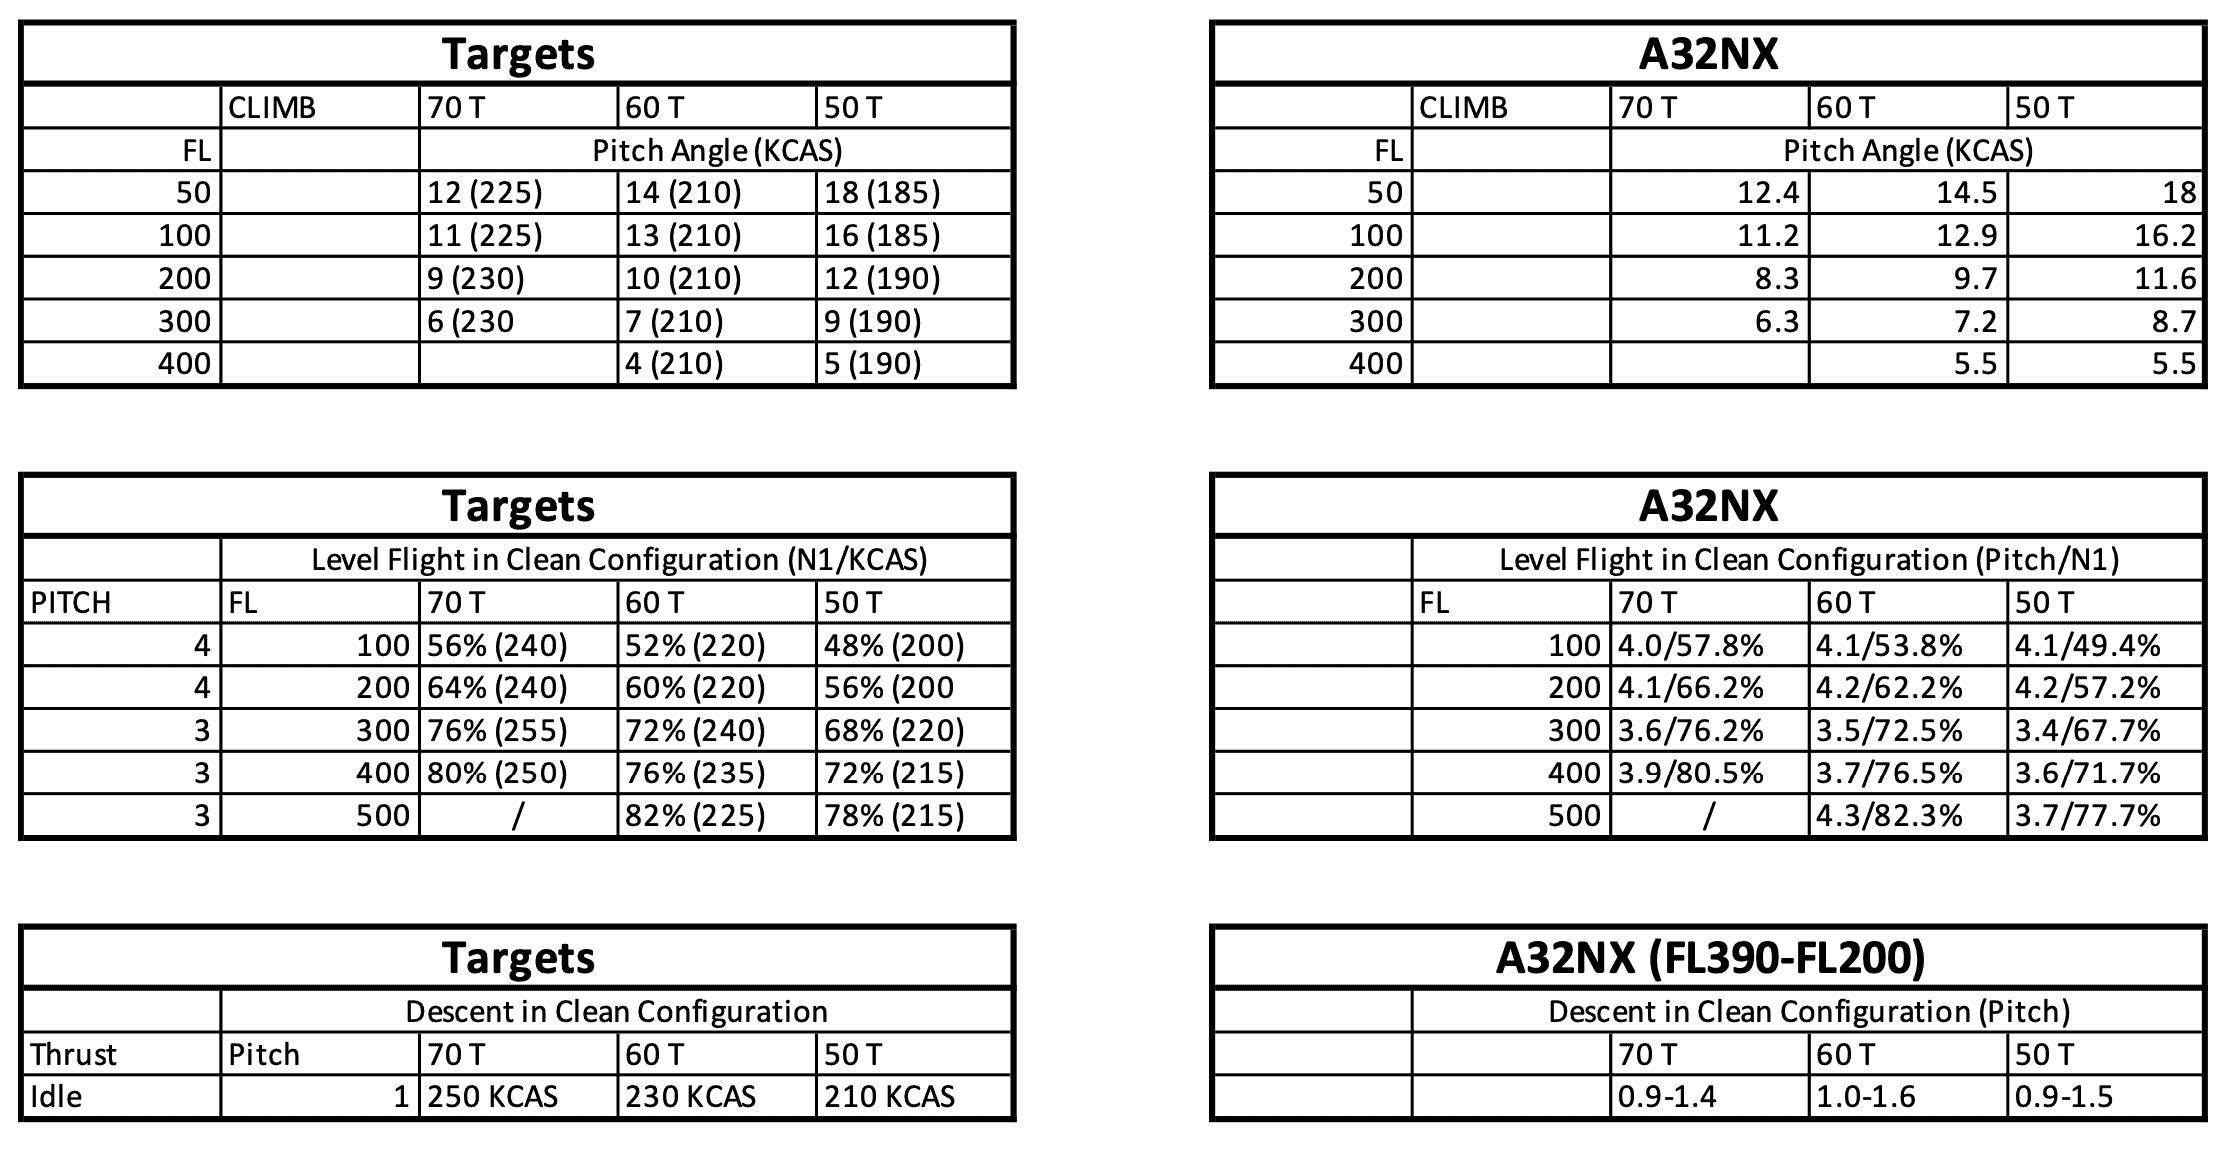
The following table represents pitch angle/N1 values at 3000 feet. These values are valid for both our Stable and Development versions.
Cruise Check Data
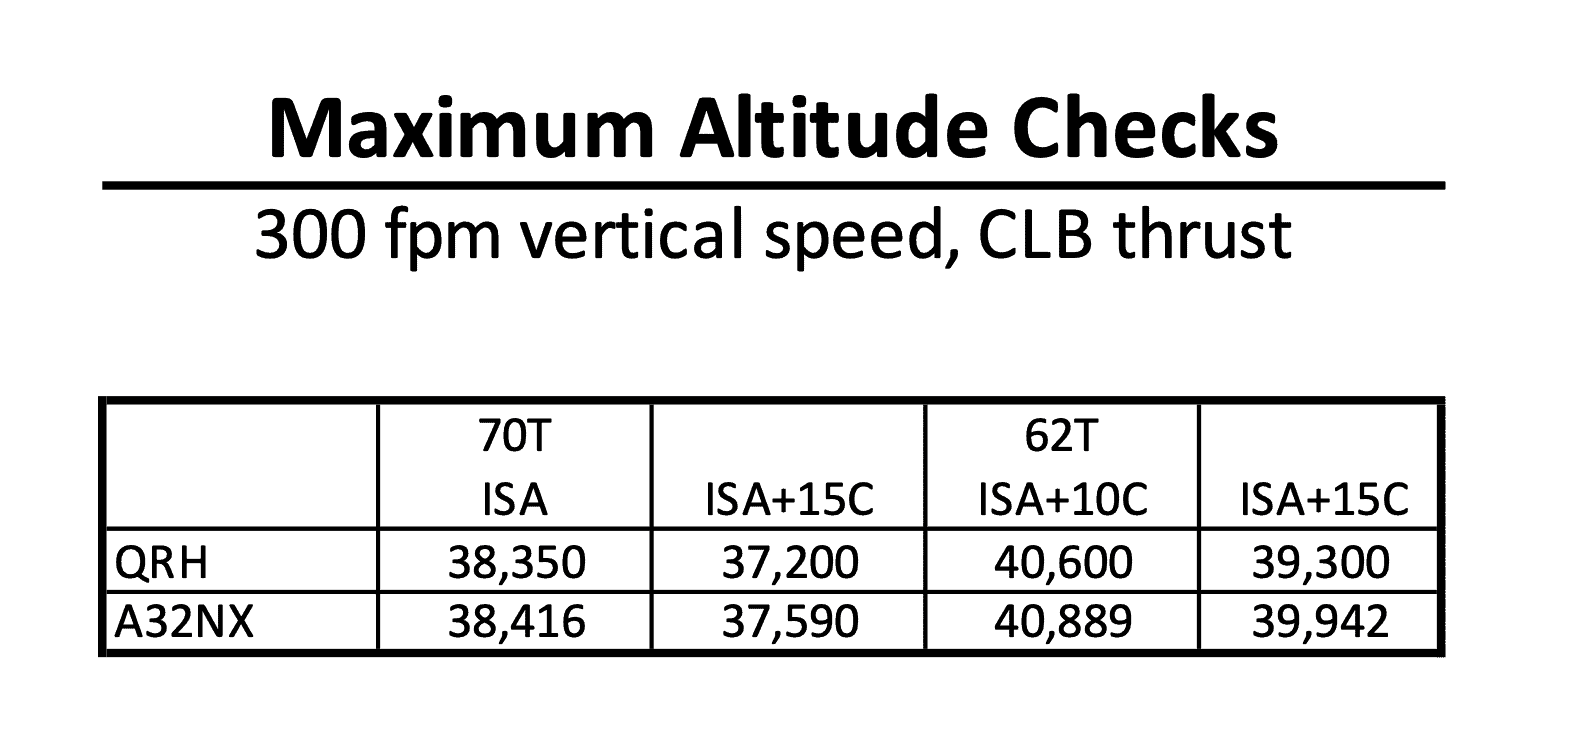
Maximum Altitude Capability Checks
Climb Data 1
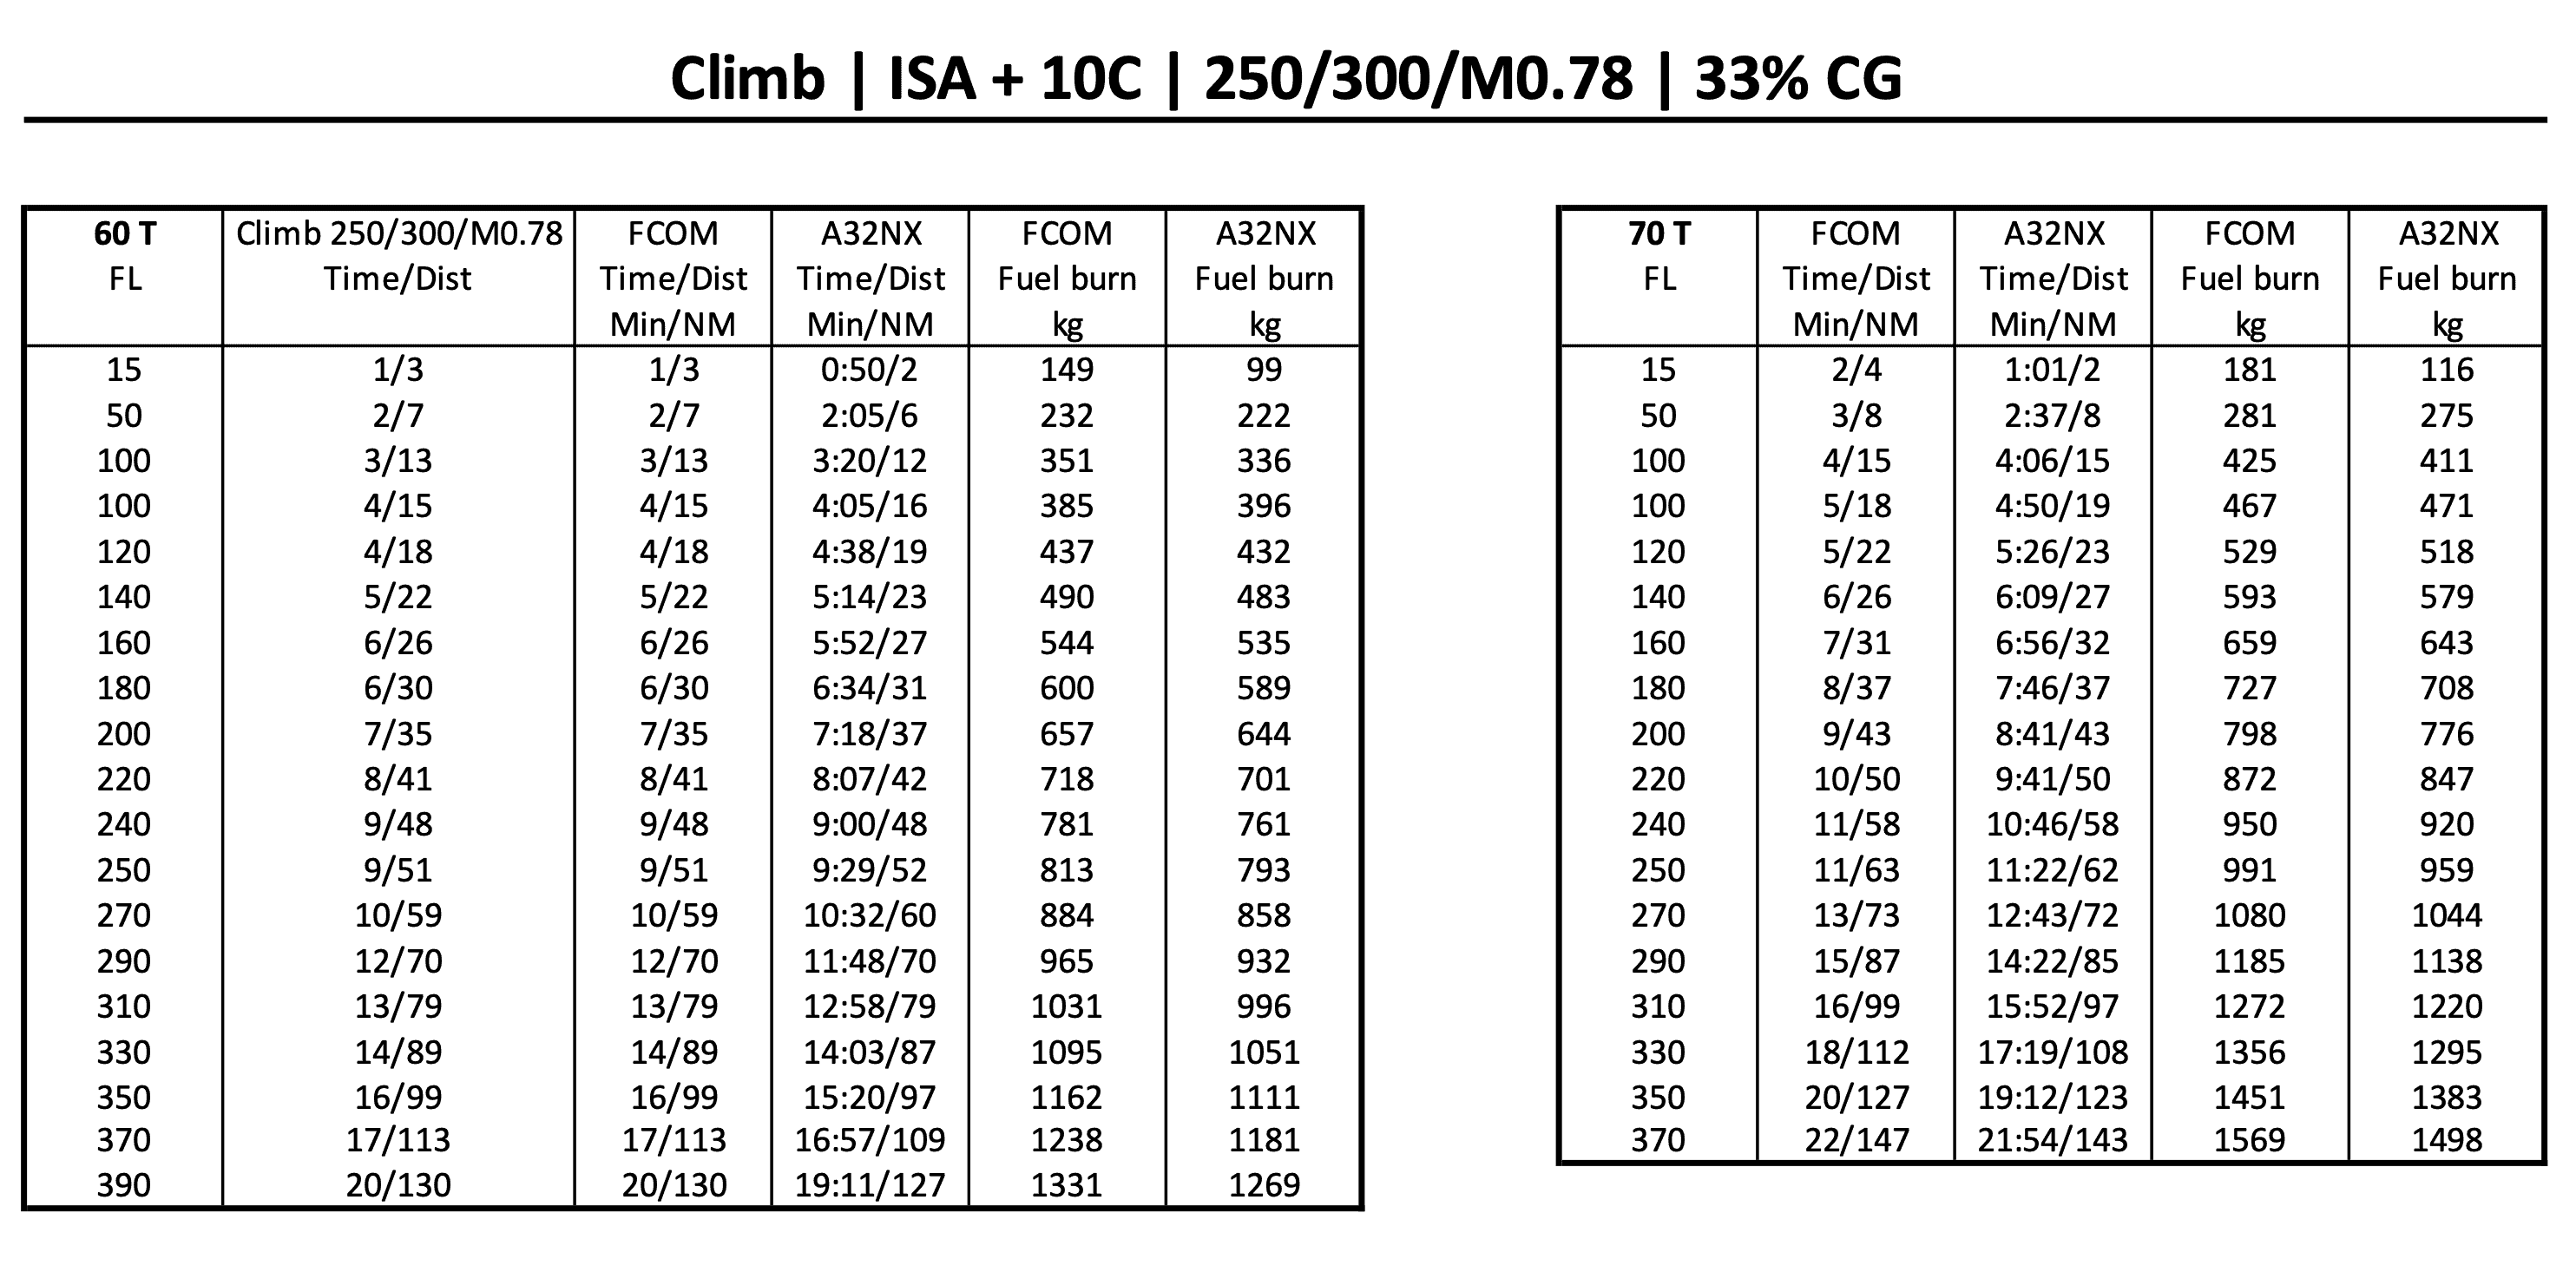
Climb Data 2
Descent Time / Distance / Fuel Compared to FCOM
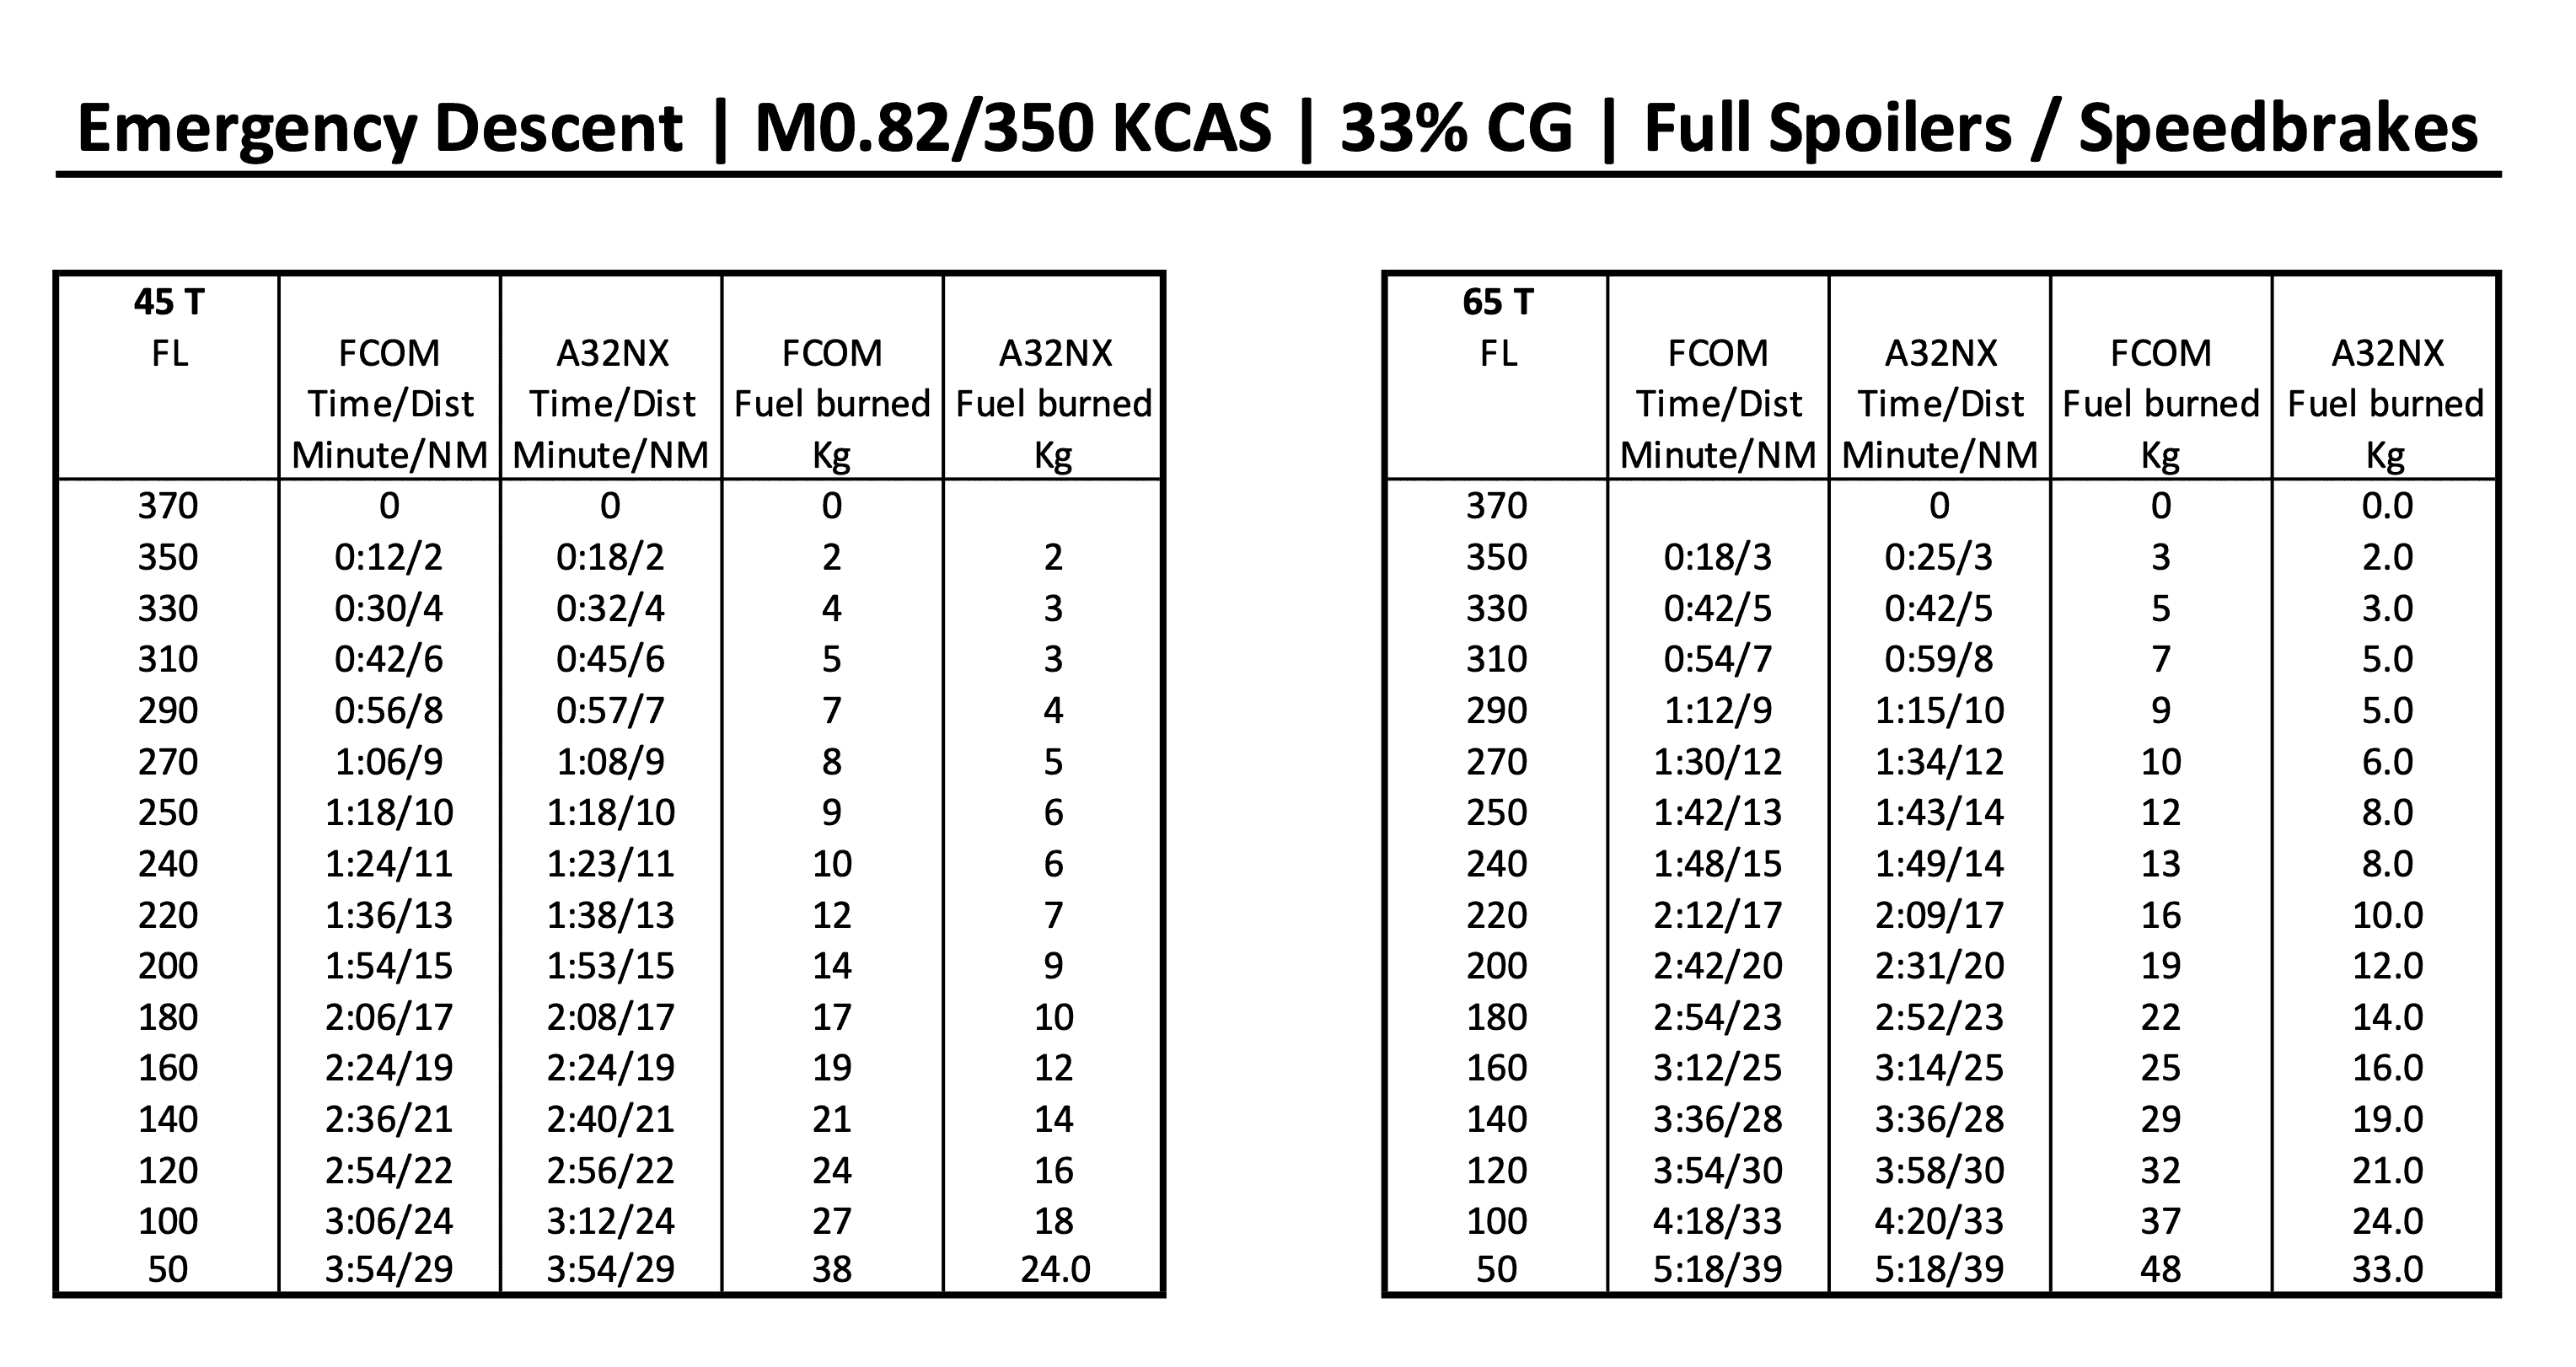
Emergency Descent Time / Distance Compared to FCOM
Decel Check for CONF 3 Approach (Data from FBW IRL A320NEO Pilot)
Conditions:
- CONF 3,
- Gear down,
- -3 degrees flight path angle,
- 51 T,
- 23 seconds decel time from 160 KCAS to 140 KCAS.
Test Procedure:
Set up at a high enough speed above 160 KCAS to be at flight idle at 160 KCAS, decel to a speed far enough below 140 KCAS to remain in flight idle through 140 KCAS. Record decel time from 160 to 140 KCAS.
Real World Target: 23 seconds
A32NX Result: 23 seconds
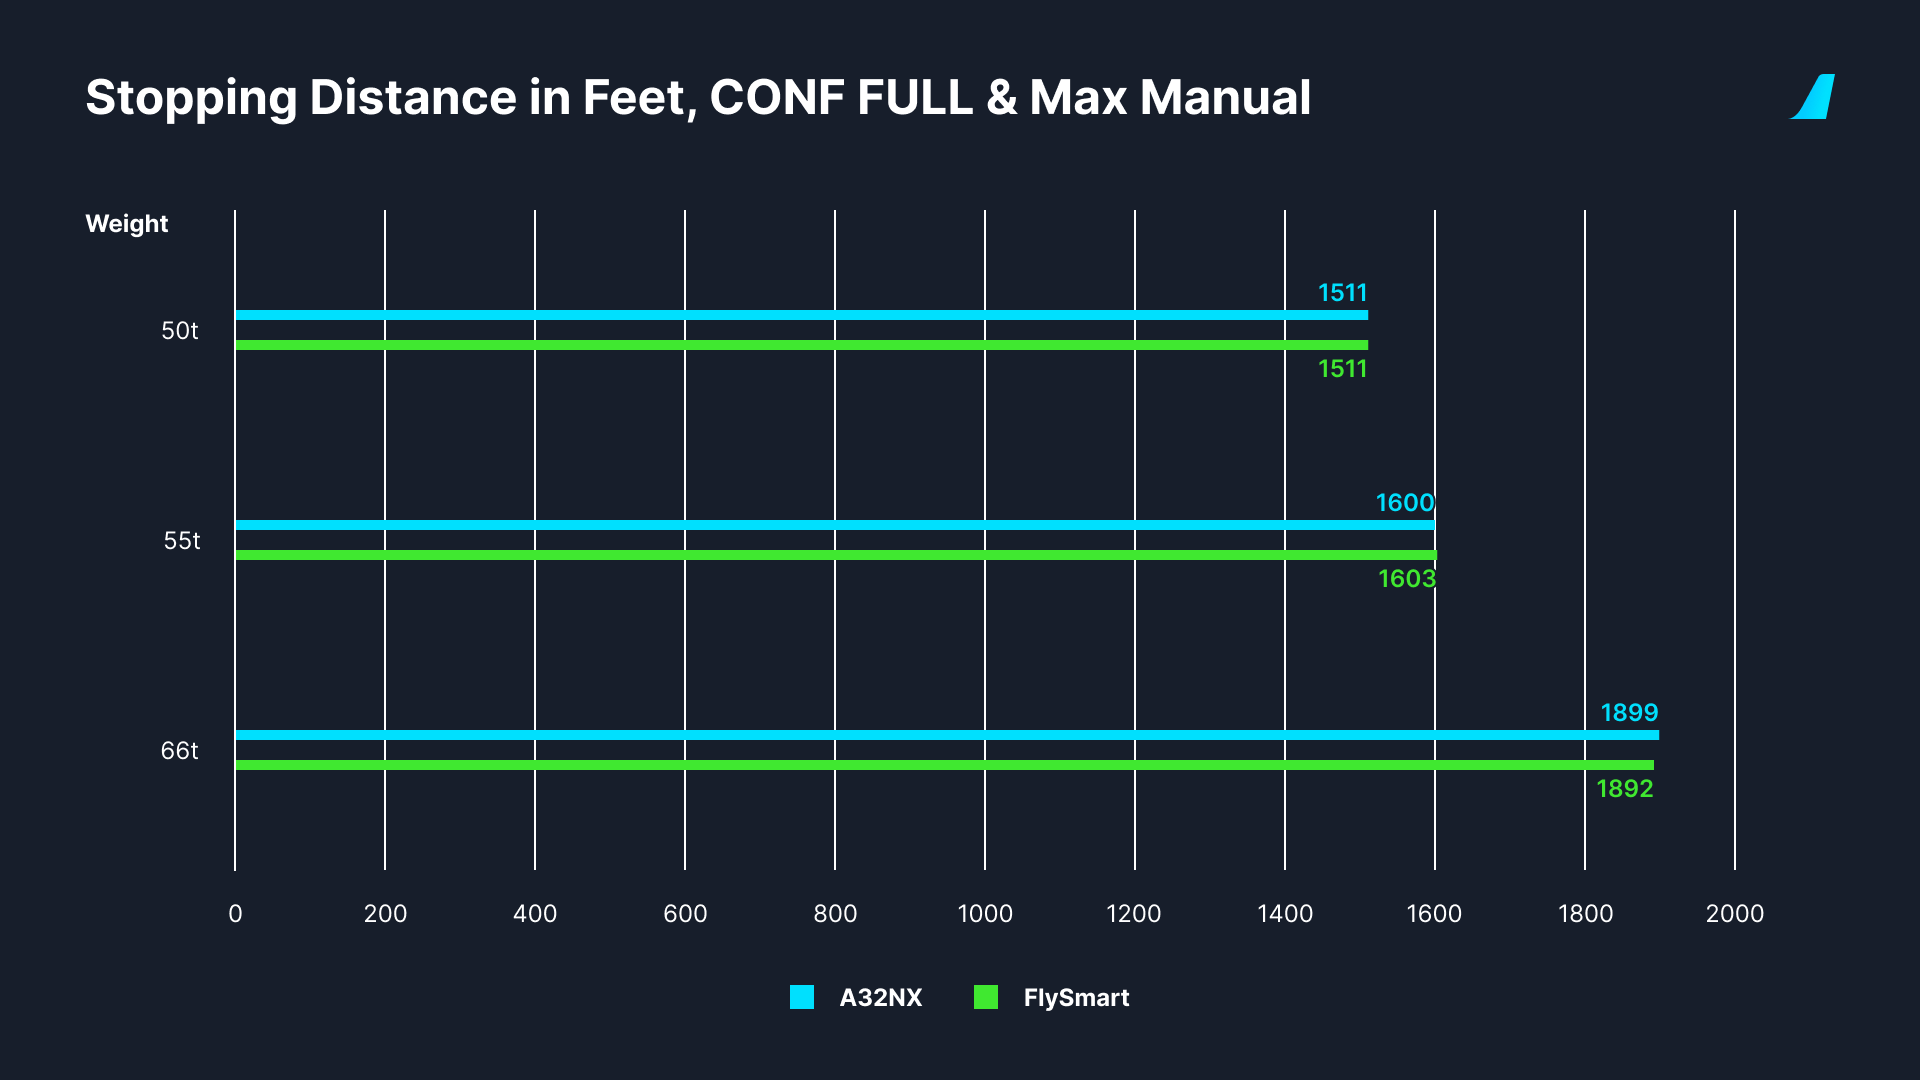
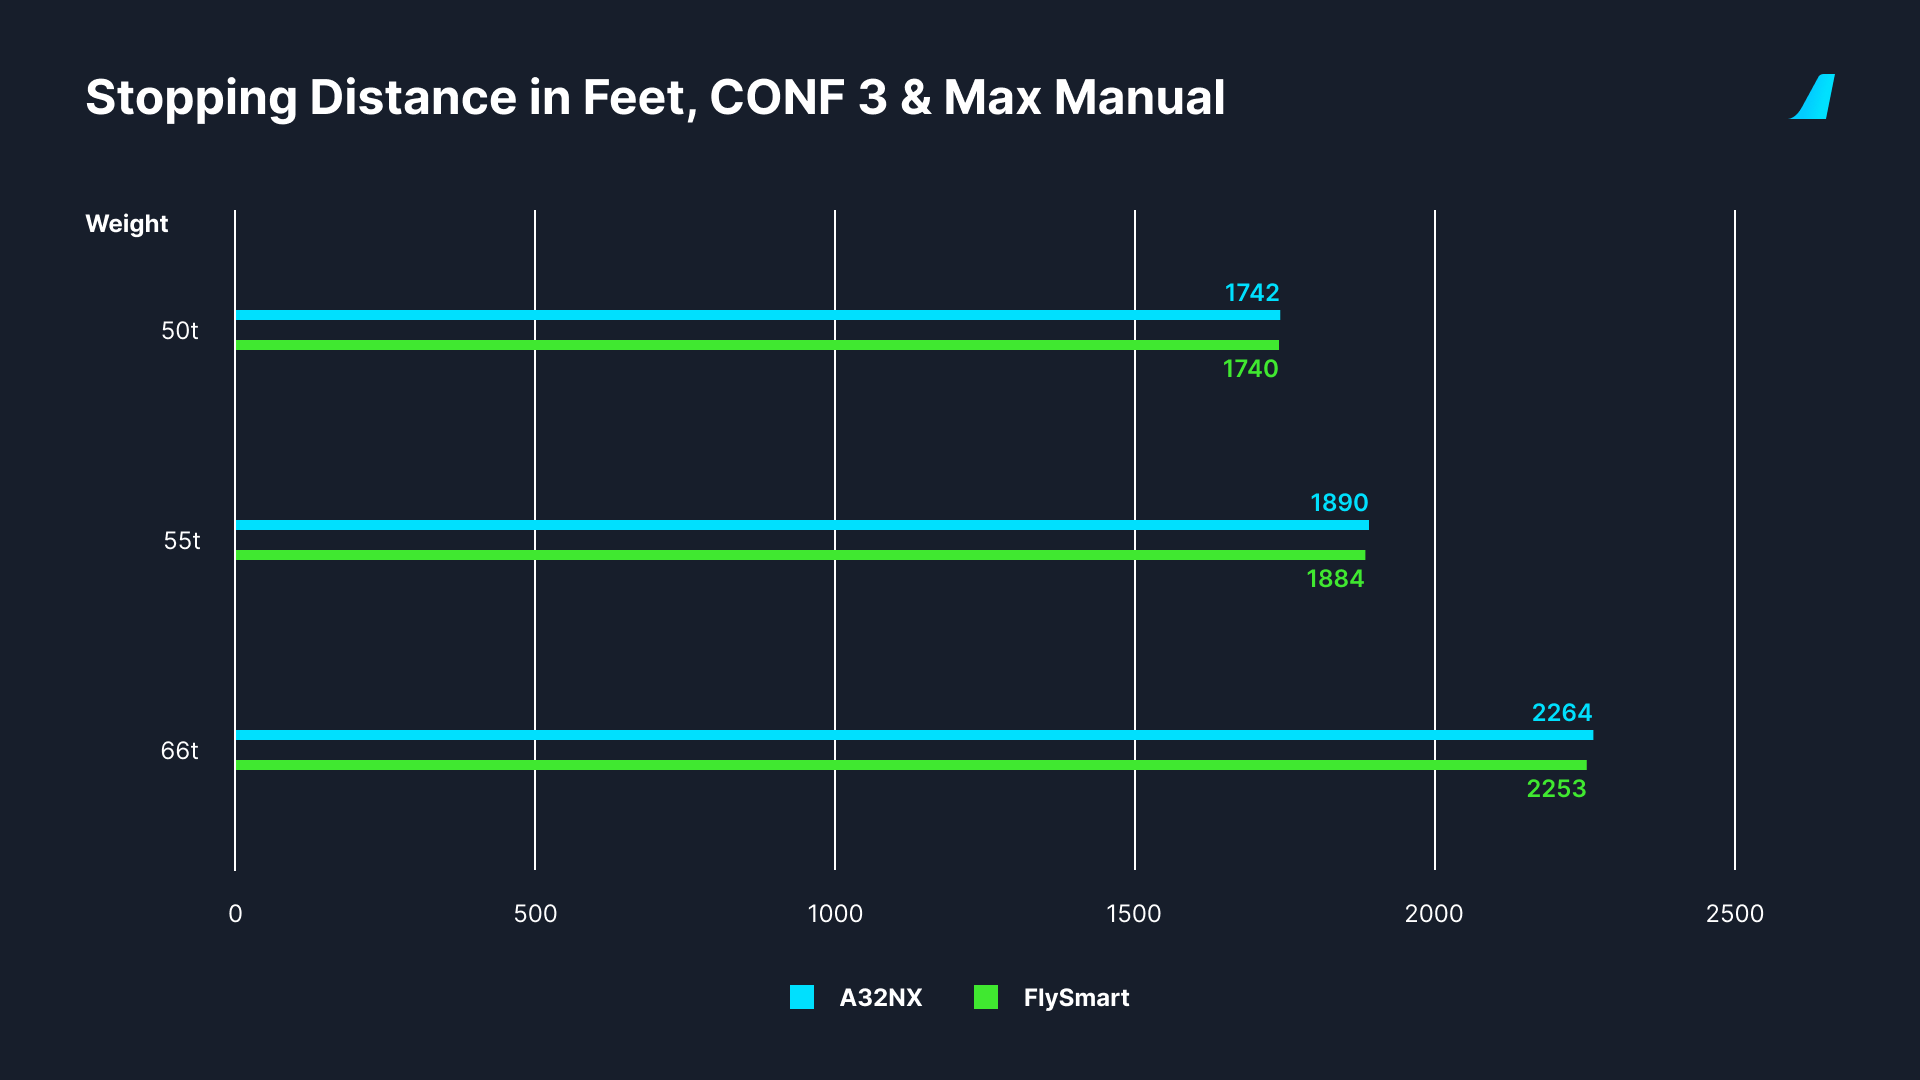
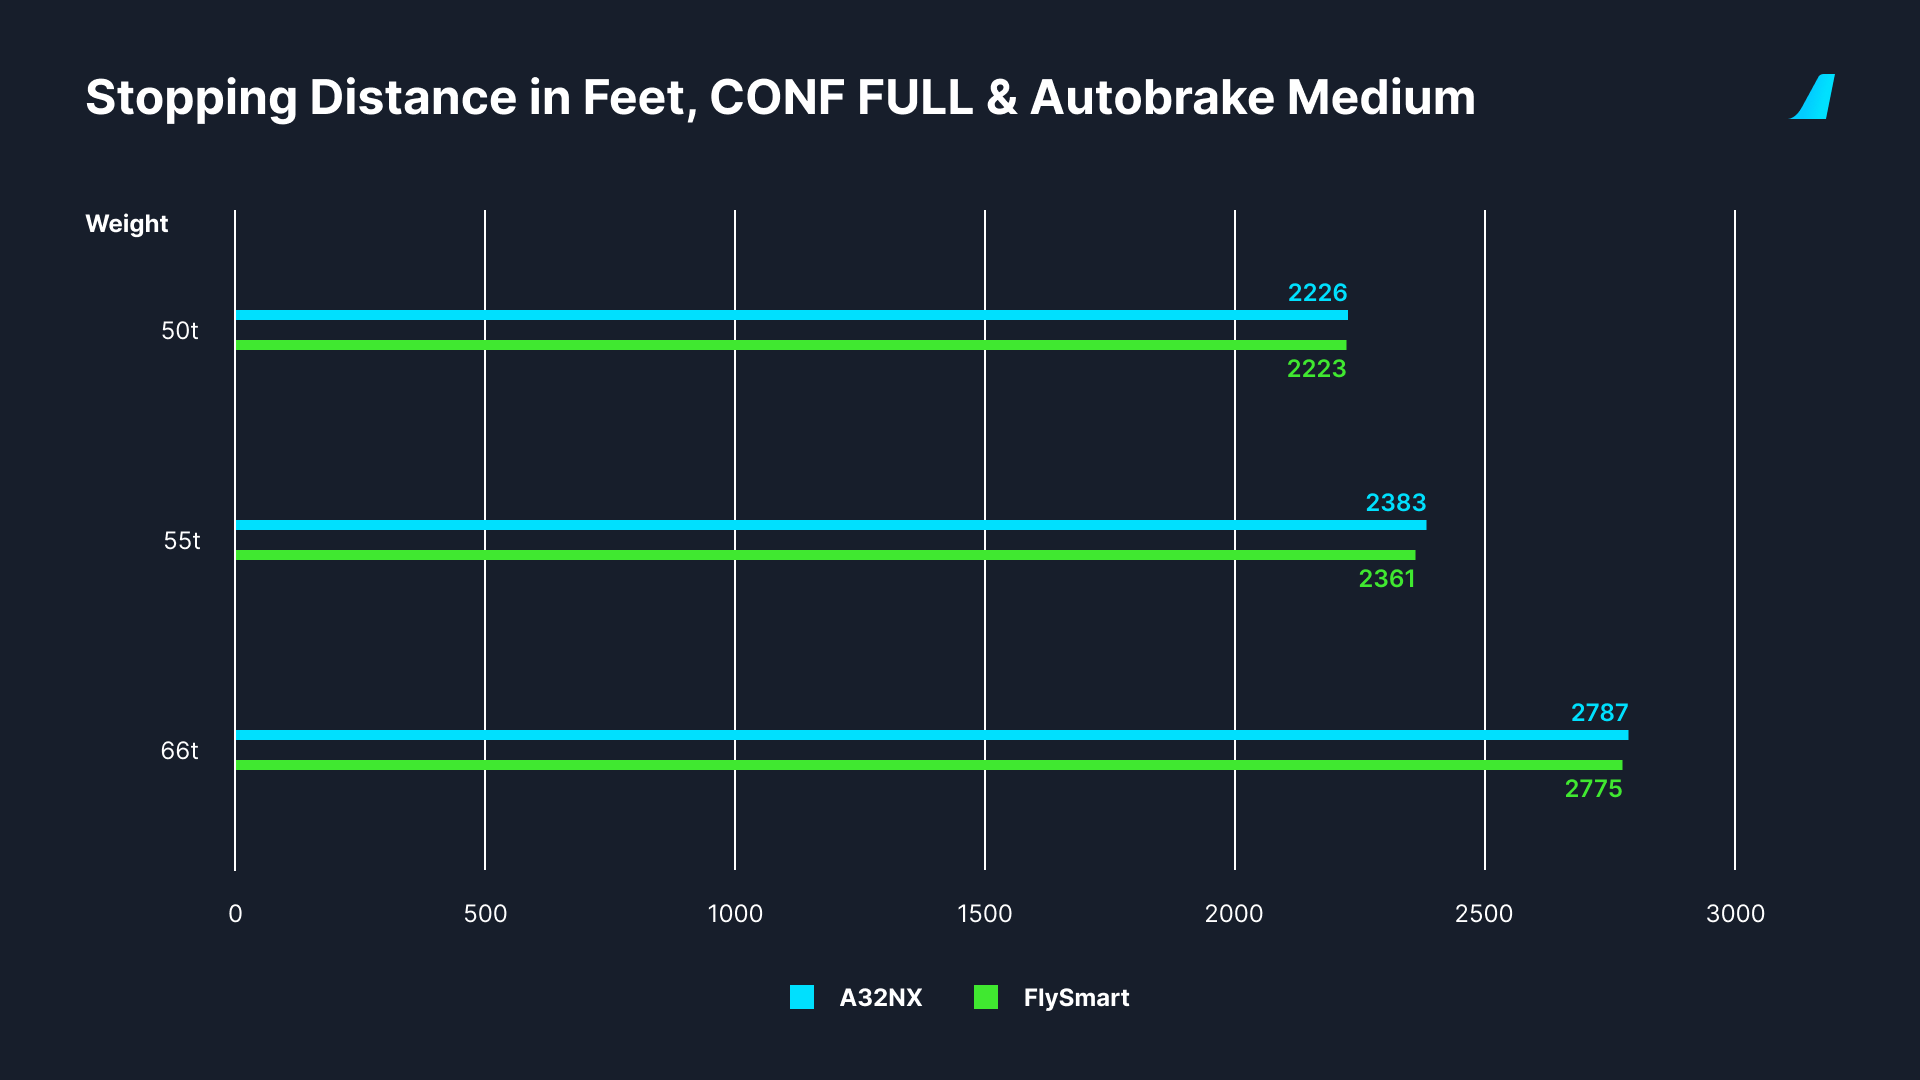
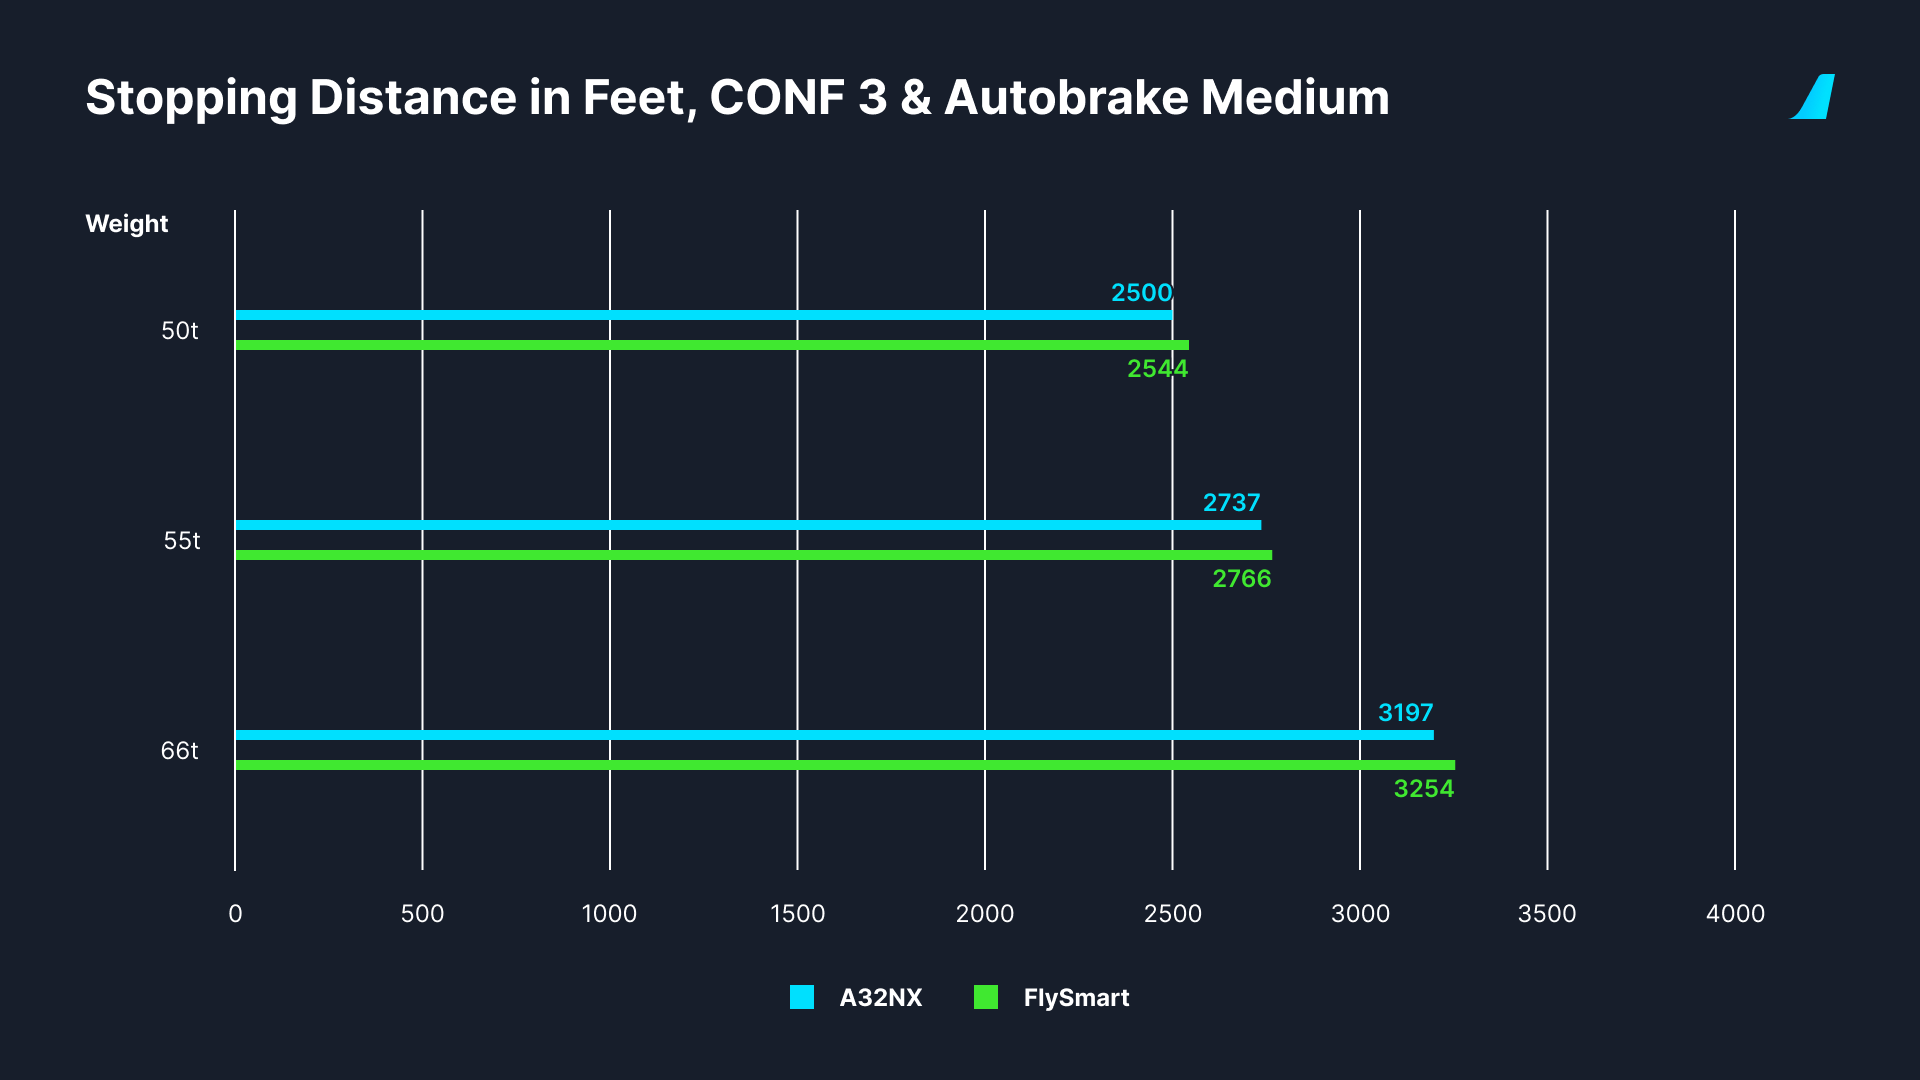
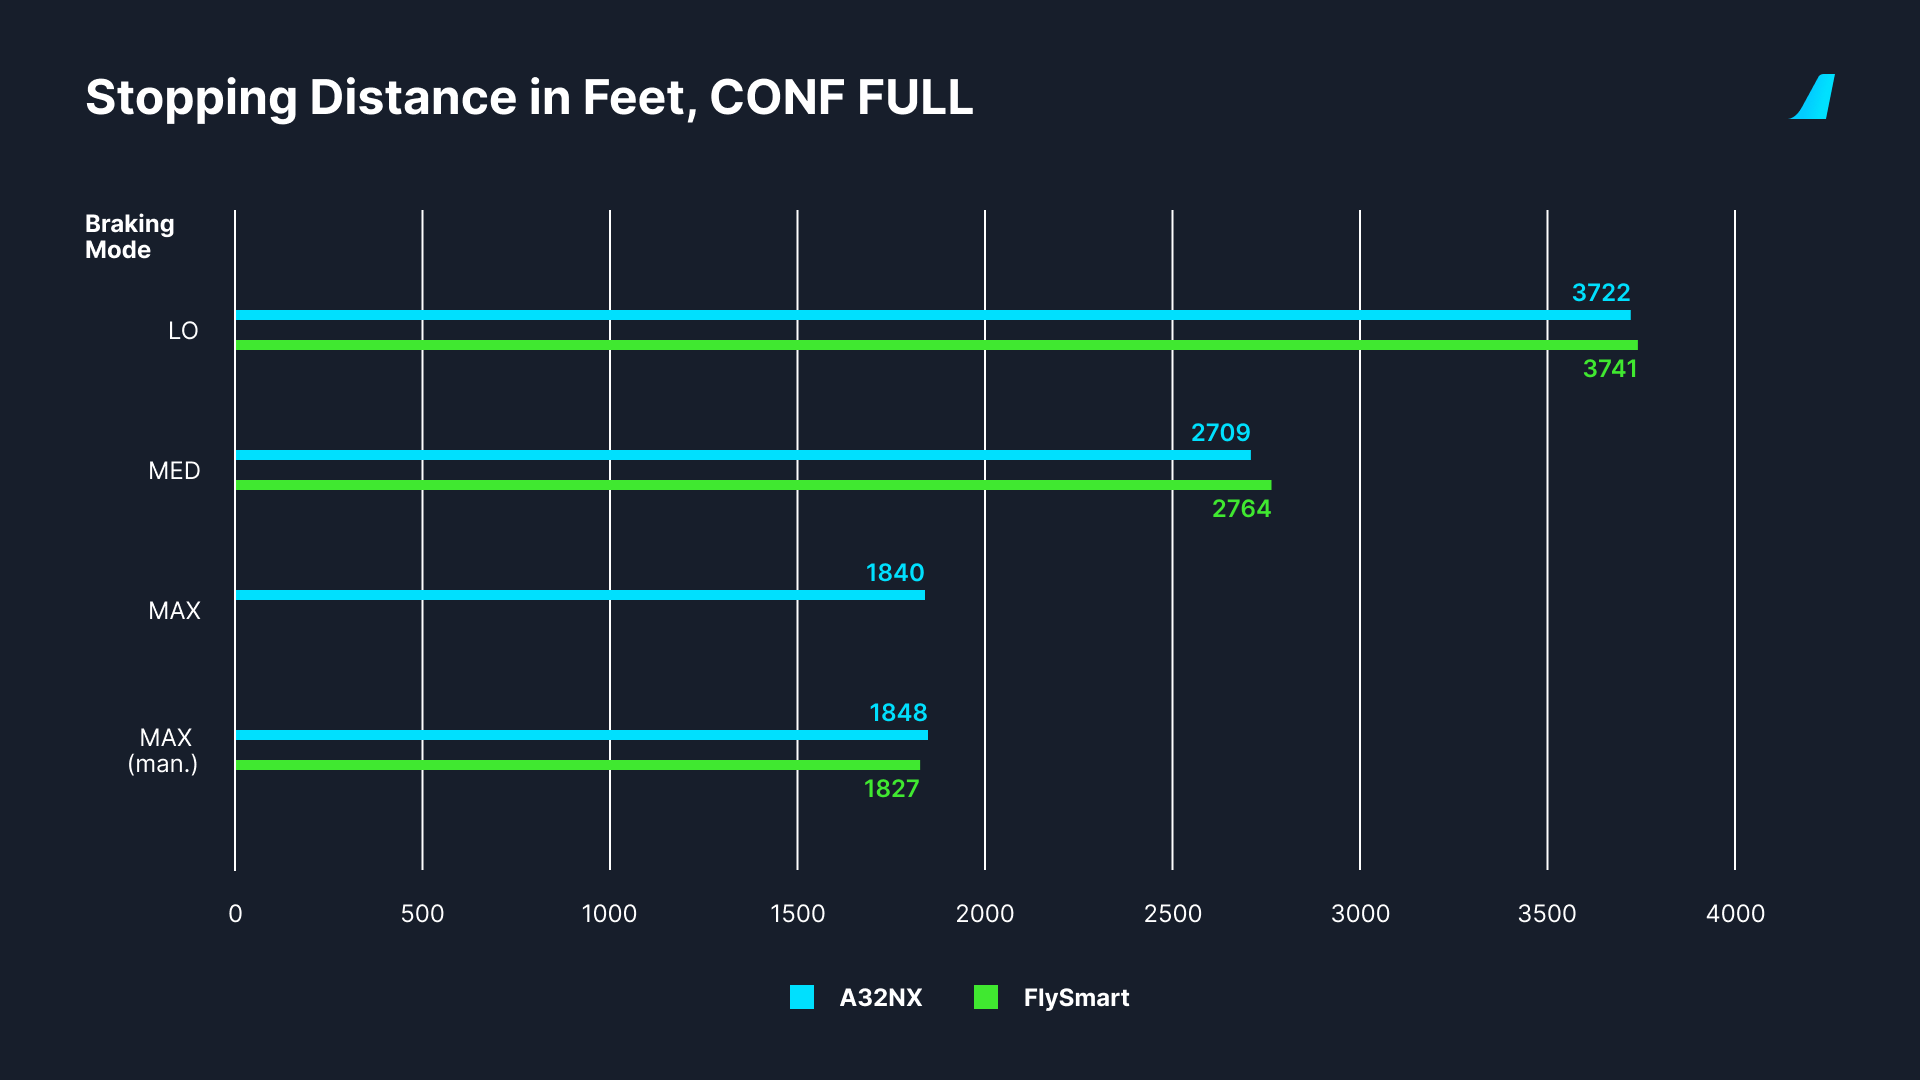
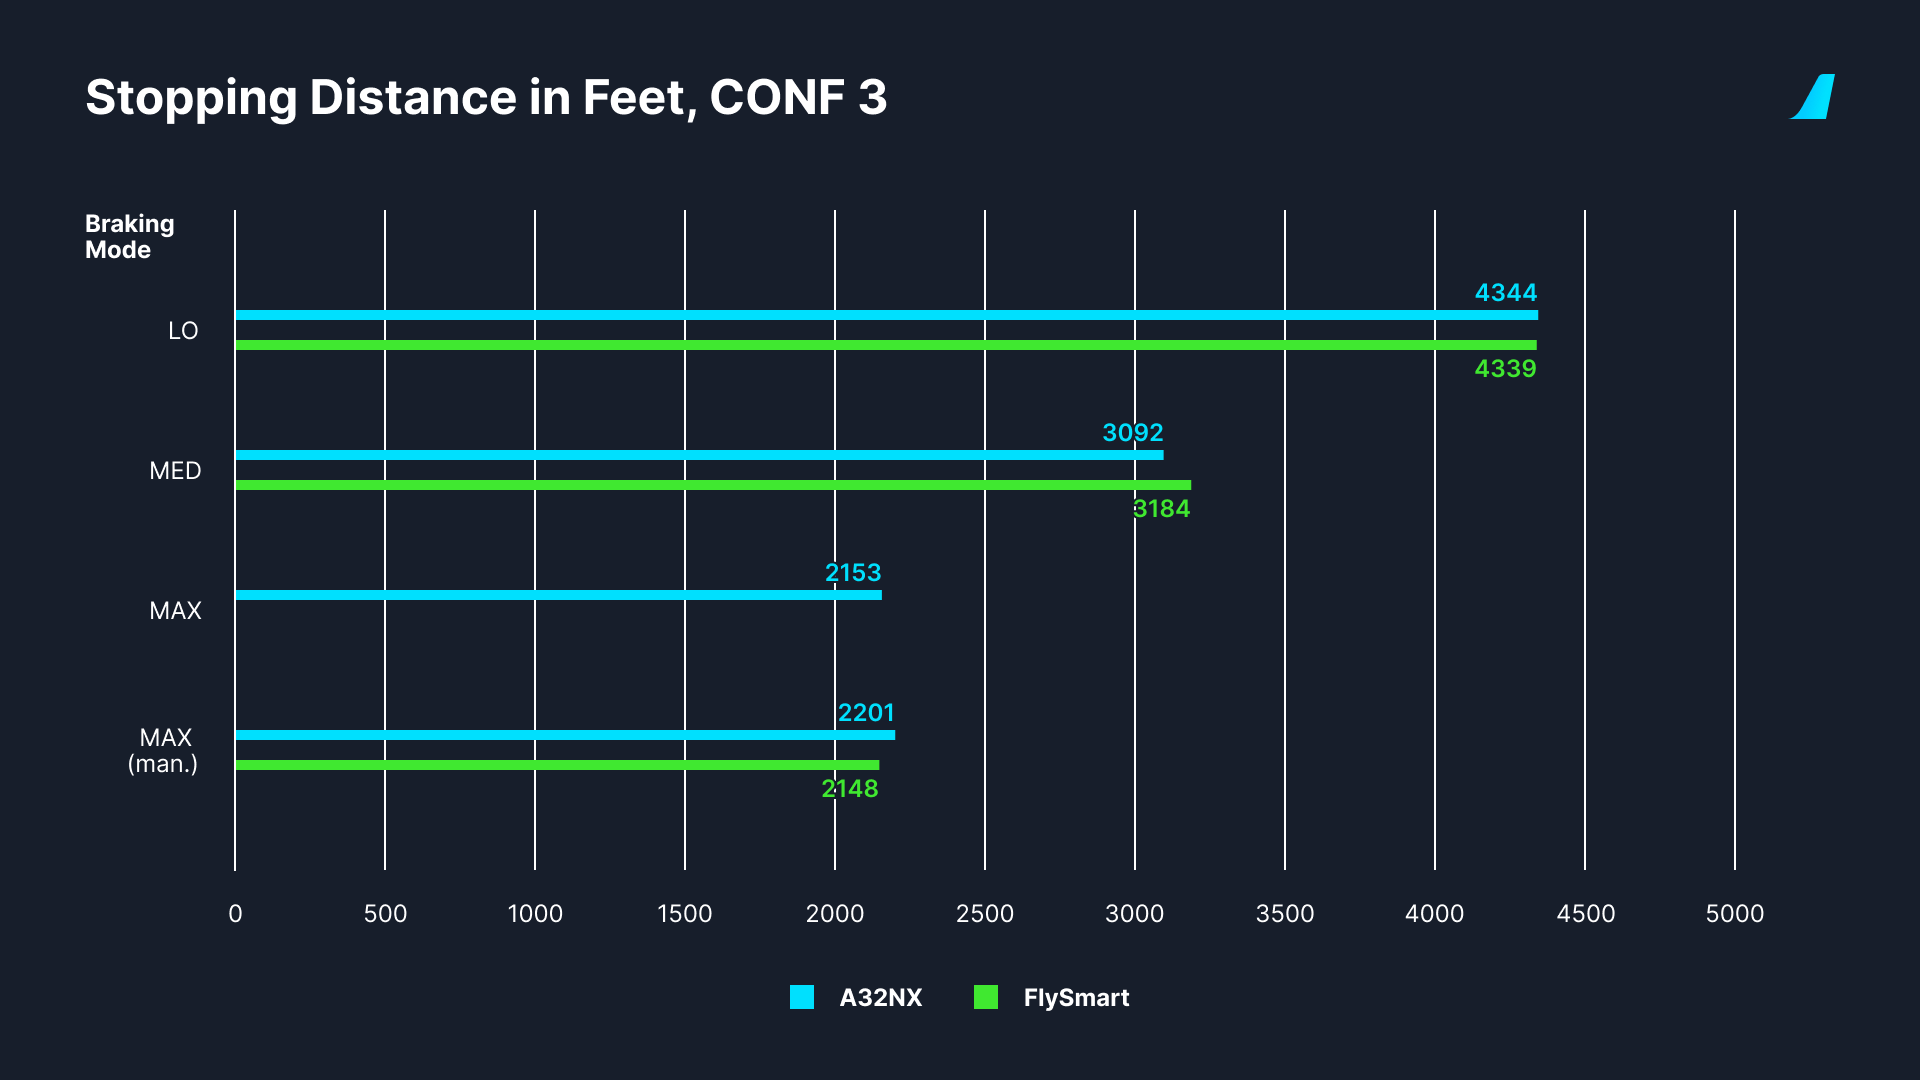
Stopping Distance
Stopping distance comparisons were made using FlySmart landing distance data. The ground roll stopping distance was derived from that landing distance data using the same methods by which the landing distance data was calculated. Stopping distances were measured during flight tests of the A32NX to compare to the stopping distances derived from the FlySmart landing distance data.
EHAM (Amsterdam Schiphol Airport) 18R, ISA, No Wind, CG<25%
Max Manual
Autobrake Medium
EDDW (Bremen Airport) 27, ISA, No Wind, CG=27%
Pilot Comments on Pitch and Roll Response
"Massive improvement"
"Roll is amazing"
“The deadband at around 10º is exactly like irl”
Pitch is "nearly perfect"
General Information
Stay up to date with information from FlyByWire Simulations by following our social media!
If you require support or would like to submit a bug report please see the links below:
When submitting an issue or asking for support to do the following:
- Visit our Reported Issues Documentation for common problems and workarounds.
- Ensure that your issue has not already been reported on our GitHub.
Download the latest version of the A32NX & A380X:
Safe skies and happy flying!
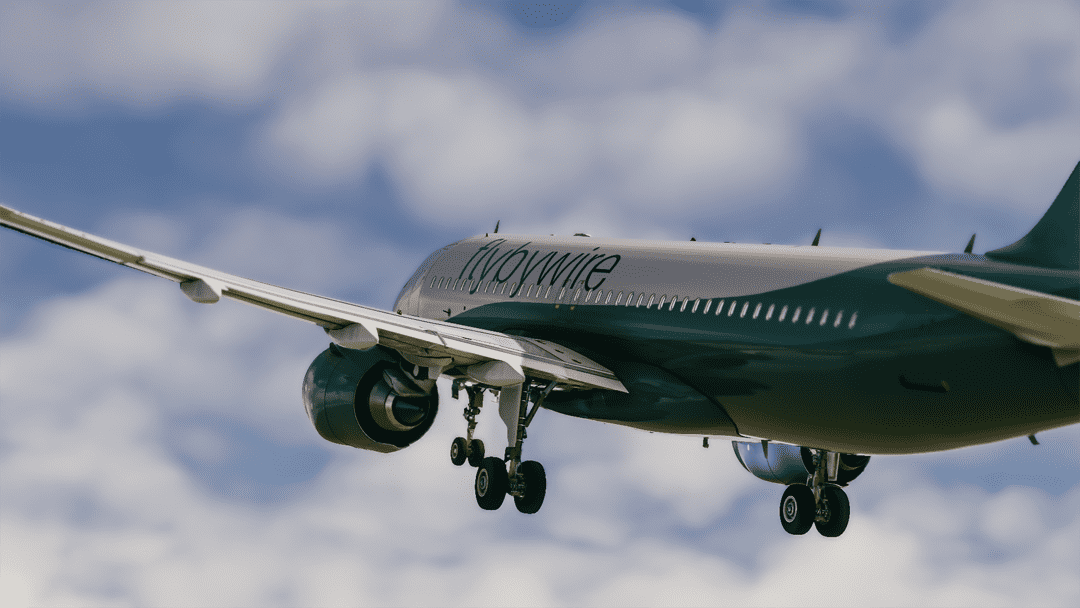
Feature Image Courtesy of Maphol - FBW Media Team
Editors: Kevin, Cdr_Maverick
Corrections: We fixed some text and added some minor clarifications to the work in progress section that was missed at publication.